Figures & data
Figure 1. The chemical structure of peucedanol.
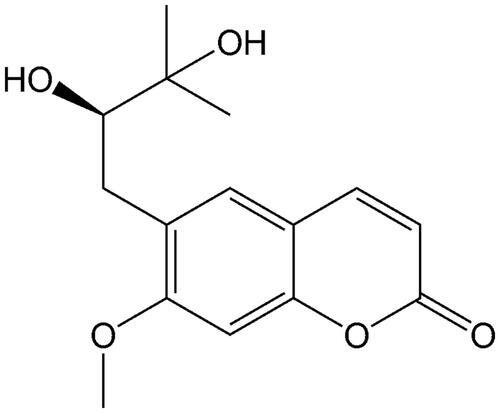
Table 1. CYP450 isoforms tested, maker reactions, incubation conditions and Km used in the inhibition study.
Table 2. HPLC conditions for the analyses of CYP450s corresponding metabolics.
Figure 2. Effect of peucedanol on the activity of eight CYP isoforms, including CYP1A2, 2A6, 3A4, 2C8, 2C9, 2C19, 2D6, and 2E1. *p < 0.05. Negative control: without any treatment; Peucedanol: treated with 100 μM peucedanol; Positive control: treated with corresponding inhibitors.

Figure 3. The inhibition of CYP1A2 (A), 3A4 (B), and 2D6 (C) by peucedanol was in a dose-dependent manner, with the IC50 values of 6.03, 7.58, and 13.57 μM, respectively.
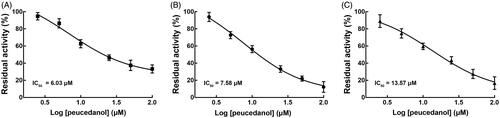
Figure 4. The inhibition model fitting and corresponding parameters calculation of CYP1A2 catalysed reactions (phenacetin O-deethylation). (A) Lineweaver-Burk plots of inhibition of peucedanol on CYP1A2 with phenacetin (20–100 μM) in the absence or presence of peucedanol (0–30 μM). The inhibition of CYP1A2 was best fitting with competitive manner. (B) Secondary plot with the values of Km/Vmax in . All data represent the mean of the incubations (performed in triplicate).
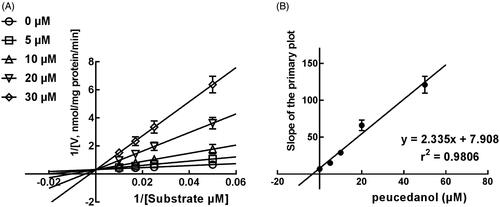
Figure 5. The inhibition model fitting and corresponding parameters calculation of CYP2D6 catalysed reactions (diclofenac 4′-hydroxylation) in pooled HLM. (A) Lineweaver-Burk plots of inhibition of peucedanol on CYP2D6 with dextromethorphan (10–50 μM) in the absence or presence of peucedanol (0–50 μM). The inhibition of CYP2D6 was best fitting with competitive manner. (B) Secondary plot with the values of Km/Vmax in . All data represent the mean of the incubations (performed in triplicate).
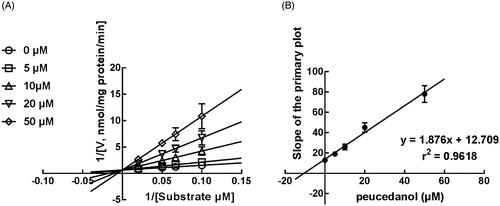
Figure 6. The inhibition model fitting and corresponding parameters calculation of CYP3A4 catalysed reactions (testosterone 6 b-hydroxylation) in pooled HLM. (A) Lineweaver-Burk plots of the of inhibition of peucedanol on CYP3A4 with testosterone (20–100 μM) in the absence or presence of peucedanol (0–30 μM). The inhibition of CYP3A4 was best fitting with non-competitive manner. (B) Secondary plot with the value of Km/Vmax in . All data represent the mean of the incubations (performed in triplicate).
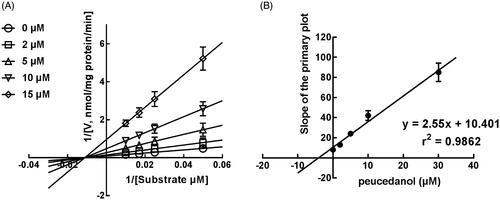
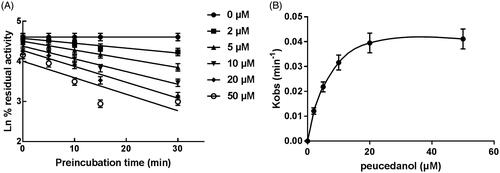
Figure 7. Time and concentration-inactivation of microsomal CYP3A4 activity by peucedanol in the presence of NADPH. (A) The initial rate constant of inactivation of CYP3A4 by each concentration (Kobs) was determined through linear regression analysis of the natural logarithm of the percentage of remaining activity versus pre-incubation time. (B) The Ki and Kinact values were determined through non-linear analysis of the Kobs versus the peucedanol concentration.