Figures & data
Figure 1. Antiproliferative effects of imatinib, dasatinib and nilotinib on the sensitive CML cell K562 and resistant CML cell K562-R. Cells were treated with different concentrations of imatinib (A), dasatinib (B) or nilotinib (C) for 48 h. The cell viability was measured using MTT assay. Data were represented as the mean ± SD obtained from three independent experiments.
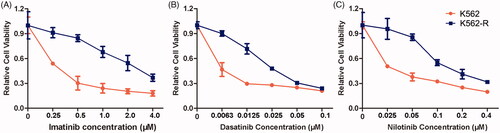
Figure 2. The combination effects of CPT and Bcr-Abl tyrosine kinase inhibitors on cell viability and activities of crucial apoptosis mediators in K562-R cells. (A) Cell viability of K562-R cells was determined by MTT assay after the exposure of CPT and dasatinib for 48 h. (B) The effects of CPT and nilotinib on the cell viability of K562-R cells were measured by MTT assay. Data was represented as the mean ± SD obtained from three independent experiments. (C) Protein expression of cleaved caspase-3, caspase-9 and PARP after the treatment of CPT and three TKIs were analysed by western blot. (D) The semi-quantitative immunoblotting staining analysis of the indicated apoptosis related proteins by Image J. (E) The phosphorylation and total protein expression levels of Bcr-Abl, Src, STAT3 and eIF4E were determined after the combination treatment of CPT and imatinib, dasatinib and nilotinib in K562-R cells. (F) The indicated protein expression levels were quantified by Image J. Data were expressed as the mean ± SD, n = 3. *p < 0.05, and **p < 0.01 denote significant differences compared with the single TKI treatment group.
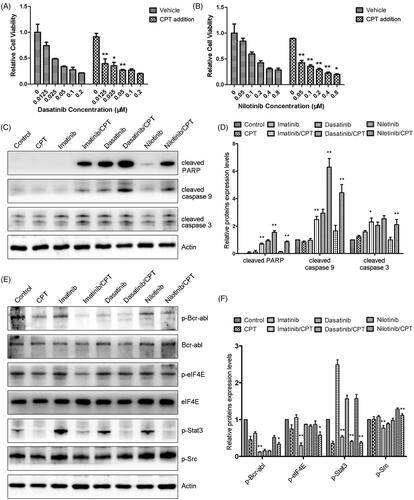
Figure 3. The antileukemia effect of combined imatinib and CPT on the growth of CML xenograft tumours. The imatinib resistance CML cells K562-R (4 × 10⁷ per mouse) were injected subcutaneously into the flank of nude mice. Treatment (6 mice per group) was started after the tumour volume approximately reached the size of 80–100 mm3. Imatinib single treatment group (50 mg/kg, daily once, p.o.), CPT single treatment group (10 mg/kg, daily once, p.o.), or the combination group of both agents. Control mice were only administrated with saline by oral gavage. (A) The average tumour volume for each group after the treatment of imatinib and CPT. (B) The body weight for each group was evaluated after the treatment of imatinib and CPT for 1 day, 7 day, 14 day and 21 day, respectively. (C) Representative images of harvested tumour tissue from four group. (D) Tumour weight for each group at the end of the observation period. The data was represented as the mean ± SD (n = 6). **p < 0.01 denotes significant differences compared with the control group.
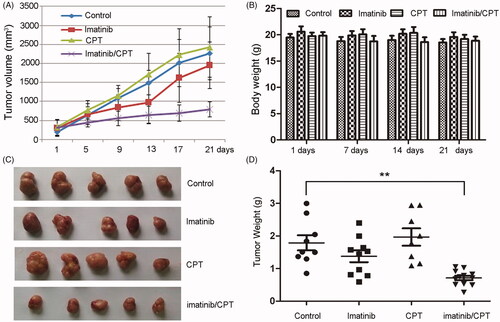
Figure 4. The effects of combined imatinib and CPT on the apoptotic rate and microvascular density value in tumour tissues. (A) Representative images of sections of HE staining, TUNEL staining and CD 34 staining analysis in xenograft tumour tissues produced by K562-R cells. (B) The quantified data of the apoptotic rates in tumour tissue after the treatment of imatinib and CPT. (C) The microvascular density value of each group was analysed by CD 34 staining. Scale bar = 50 µm. *p < 0.05 and **p < 0.01 denote significant differences compared with the control group.
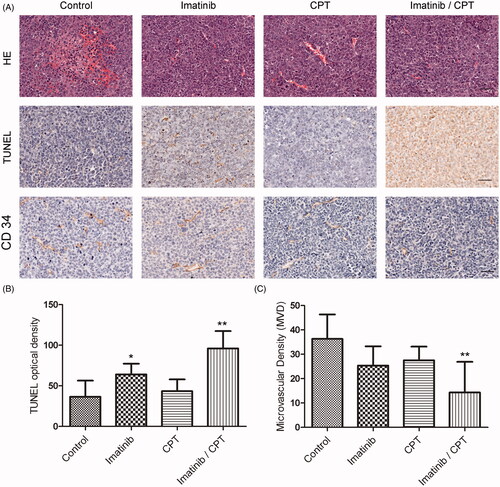
Figure 5. The effect of combined imatinib and CPT on the expression levels of Ki-67 and PCNA in CML xenograft tissues. (A) The expression levels of Ki-67 and PCNA were determined by immunohistochemical staining. (B) Semi-quantitative analysis of the immunohistochemical staining of Ki-67 after the treatment of imatinib and CPT. (C) Semi-quantitative analysis of the immunohistochemical staining of PCNA after the treatment of imatinib and CPT. Scale bar = 50 µm. Average data were represented as the mean ± SD (n = 5). *p < 0.05, **p < 0.01 and ***p < 0.001 denote significant differences compared with the control group.
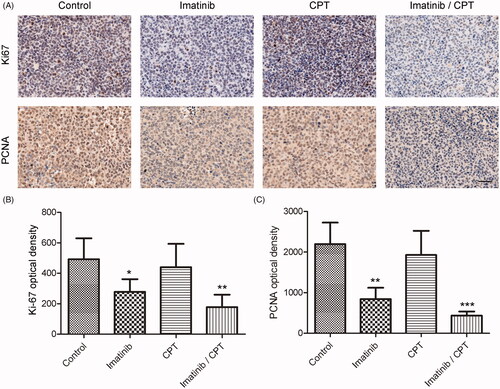
Figure 6. The effect of combined imatinib and CPT on the activities of STAT3 and eIF4E signalling pathway. (A) Immunohistochemistry staining of p-STAT3 and p-eIF4E on tumour tissues after the treatment of imatinib and CPT in each group. The positive staining was depicted in brown. (B) Semi-quantitative analysis of p-STAT3 staining through the image analyser. (C) Semi-quantitative analysis of the immunohistochemical staining of p-eIF4E through the image analyser. Scale bar = 50 µm. Average data were represented as the mean ± SD (n = 5). *p < 0.05 and **p < 0.01 denote significant differences compared with the control group.
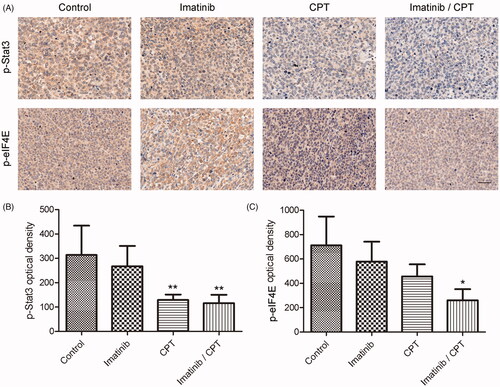
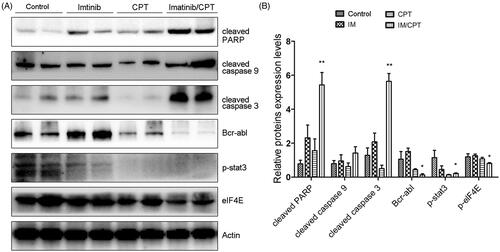
Figure 7. CPT and imatinib treatment promoted the cleavages of caspase proteins and inhibited the expression levels of Bcr-Abl, p-STAT3 and p-eIF4E in tumour tissues. (A) Western blotting analysis on the expression levels of cleaved caspase-3, caspase-9 and PARP of tumour tissues from different groups. (B) Quantification of the cleaved caspase proteins by Image J. (C) Western blotting analysis on the expression levels of Bcr-Abl, p-STAT3 and p-eIF4E of tumour tissues from each group. (D) Quantification of the of the indicated crucial mediators in CML. The greyscale scans analysis of the western blot images was from three independent experiments and fold changes include the normalisation to β-actin. Data are represented as the mean ± SD. *p < 0.05, and **p < 0.01 denote significant differences compared with the single imatinib treatment group.