Figures & data
Figure 1. Esculin attenuates MCD diet-induced ALT and AST levels in serum. (A) Structure of esculin. (B) Body weight and liver index. (C) Level of ALT and AST in serum. (D) Level of TC and TG in serum. Data are expressed as mean ± SEM, n = 3. *p < 0.05, **p < 0.01, ***p < 0.001 vs. MCS group. #p < 0.05, ##p < 0.01, ###p < 0.001 vs. MCD group. MCS: methionine and choline supplemented; MCD: methionine and choline-deficient.
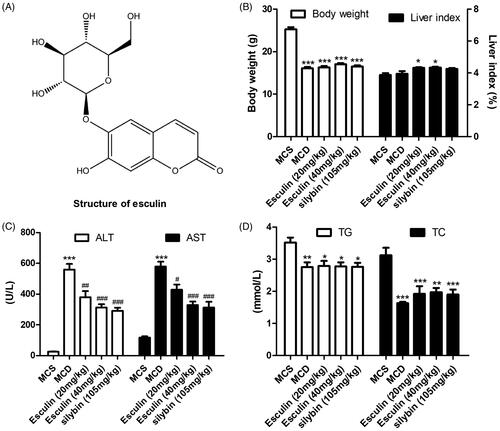
Table 1. Composition of the MCS diet and MCD diet formulas.
Figure 2. Esculin attenuates MCD diet-induced hepatic lipid accumulation. (A) Representative H&E staining images of the liver section from each group (400× magnification, scale bar: 50 µm). (B) Representative Oil Red O staining images of the liver section from each group (400× magnification, scale bar: 50 µm). (C) Level of TG in the liver tissue. (D) Level of TC in the liver tissue. (E) Level of FFA in the liver tissue. (F) Level of ADRP mRNA in the liver tissue. (G) Level of FASN mRNA in the liver tissue. (H) Level of CD36 mRNA in the liver tissue. Data are expressed as mean ± SEM, n = 3. ***p < 0.001 vs. MCS group. #p < 0.05, ##p < 0.01, ###p < 0.001 vs. MCD group. MCS: methionine and choline supplemented; MCD: methionine and choline-deficient.
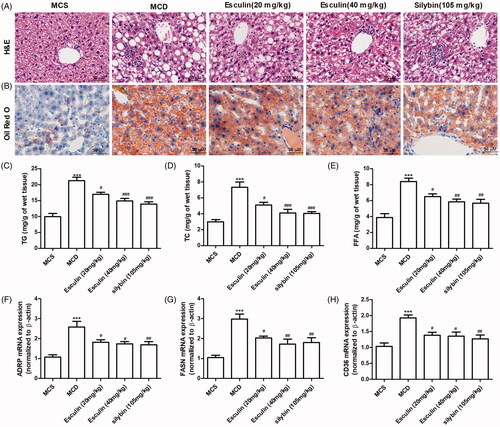
Figure 3. Esculin attenuates MCD diet-induced fibrosis and inflammation. (A) Representative Masson trichrome staining images of the liver section from each group (400× magnification, scale bar: 50 µm). (B) Representative images from the immunohistochemistry analysis of the collagen 4A1 protein in the liver of each group (400× magnification, scale bar: 50 µm). (C) Representative immunohistochemical images of the fibronectin protein in the liver of each group (400× magnification, scale bar: 50 µm). (D) Representative immunohistochemical images of the F4/80 protein in the liver of each group (400× magnification, scale bar: 50 µm). (E) Level of TNF-α in the liver tissue. (F) Level of IL-6 in the liver tissue. (G) Level of IL-1β in the liver tissue. Data are expressed as mean ± SEM, n = 3. ***p < 0.001 vs. MCS group. #p < 0.05, ##p < 0.01, ###p < 0.001 vs. MCD group. MCS: methionine and choline supplemented; MCD: methionine and choline-deficient.
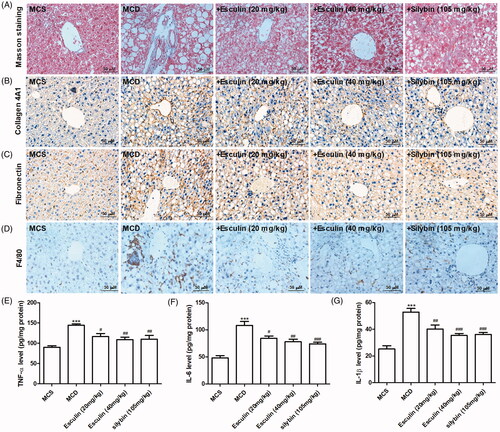
Figure 4. Esculin inhibits the acetylation of NF-κB in MCD diet-induced mice. (A) Representative immunofluorescence images of the NF-κB p65 protein in the liver of each group (400× magnification, scale bar: 50 µm). (B) Representative immunofluorescence images of the Sirt1 protein in the liver of each group (400× magnification, scale bar: 50 µm). (C) Western Blot analysis of ac-NF-κB p65. (D) Densitometric analyses of ac-NF-κB p65. Data are expressed as mean ± SEM, n = 3. ***p < 0.001 vs. MCS group. ##p < 0.01 vs. MCD group. MCS: methionine and choline supplemented; MCD: methionine and choline-deficient.
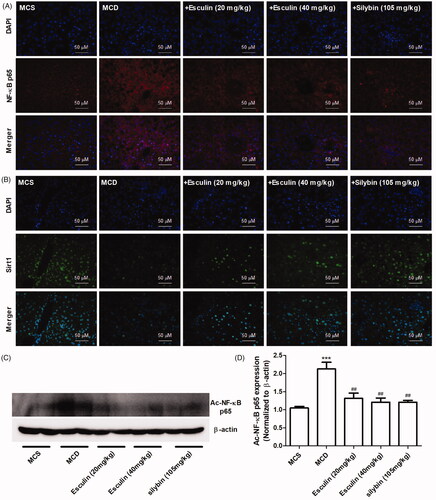
Figure 5. Esculin improves FFA-induced hepatocyte inflammation. (A) Effect of various concentrations of esculin on cell viability. (B) Representative Oil Red O staining images (400× magnification, scale bar: 50 µm). (C) Quantitative analysis of Oil Red O staining. (D) The mRNA levels of TNF-α. (E) The mRNA levels of IL-6. (F) Western Blot analysis of ac-NF-κB and Sirt1. (G) Densitometric analyses of ac-NF-κB. (H) Densitometric analyses of Sirt1. Data are expressed as mean ± SEM, n = 3. **p < 0.01, ***p < 0.001 vs. control group. #p < 0.05, ##p < 0.01, ###p < 0.001 vs. FFA group. FFA: free fatty acid.
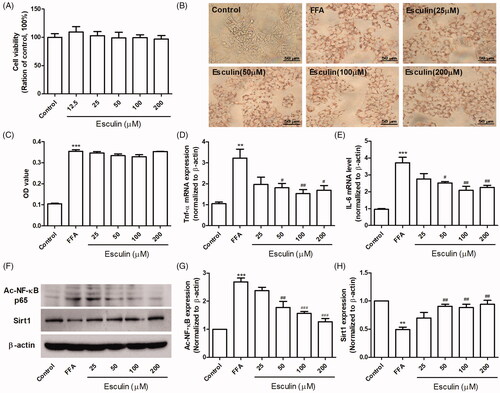
Figure 6. Sirt1 inhibitor abolishes the protective effect of esculin against FFA-induced hepatocyte inflammation. (A) Level of ALT in the cell culture supernatant. (B) Level of AST in the cell culture supernatant. (C) Level of IL-6 in the cell culture supernatant. (D) Level of TNF-α in the cell culture supernatant. Data are expressed as mean ± SEM, n = 3. ***p < 0.001 vs. control group. ##p < 0.01, ###p < 0.001 vs. FFA group. $p < 0.05 vs. + esculin group. FFA: free fatty acid.
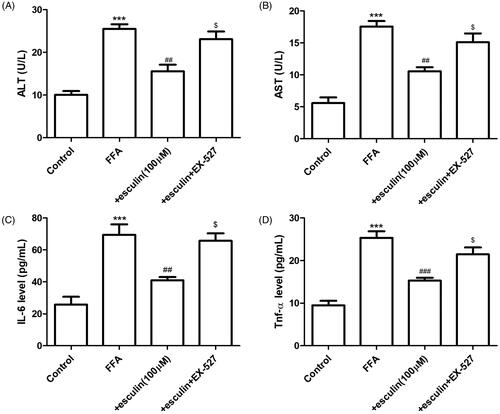
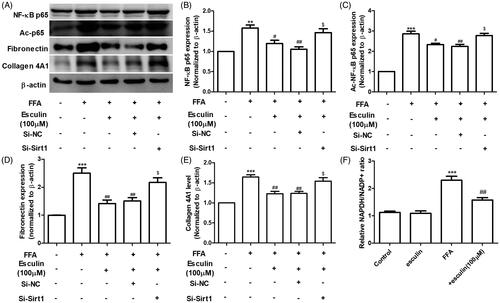
Figure 7. Sirt1 silencing affects the activity of esculin on FFA-induced inflammation and fibrosis. (A) Western blot analysis of NF-κB p65, ac-NF-κB p65, fibronectin, collagen 4A1, and β-actin. (B) Densitometric analyses of NF-κB p65. (C) Densitometric analyses of ac-NF-κB p65. (D) Densitometric analyses of fibronectin. (E) Densitometric analyses of collagen 4A1. (F) Relative NADPH/NADP+ ratio. Data are expressed as mean ± SEM, n = 3. **p < 0.01, ***p < 0.001 vs. control group. #p < 0.05, ##p < 0.01 vs. FFA group. $p < 0.05 vs. FFA + esculin + Si-NC group. FFA: free fatty acid, NC: negative control.