Figures & data
Figure 1. Chemical structure of compound 1 (Racemolactone I).
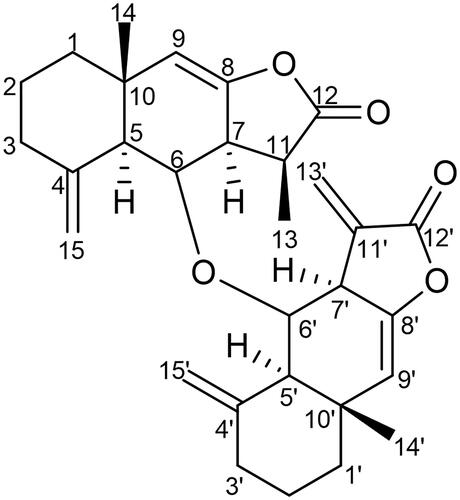
Table 1. 1H and 13C NMR spectroscopic data (δ ppm) of compound 1.
Figure 2. Cytotoxicity of compound 1 on HeLa cells treated in concentrations as indicated for 24 h and analysed by MTT assay (All data are expressed as mean ± SE from three independent experiments). *Significant p < 0.05 compared with corresponding controls.
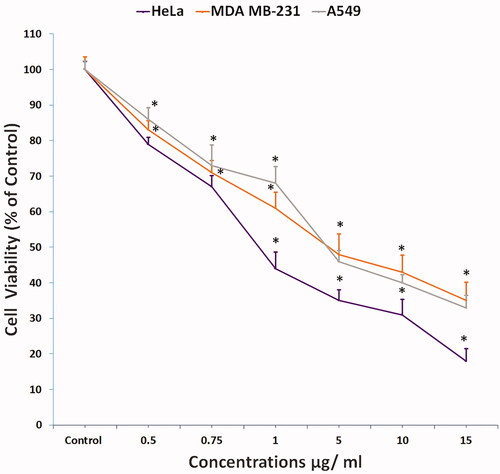
Figure 3. Cytotoxicity of compound 1 measured by LDH release from HeLa cells exposed as indicated for 24 h. (All data are expressed as mean ± SE from three independent experiments). *Significant p < 0.05 compared with corresponding controls.
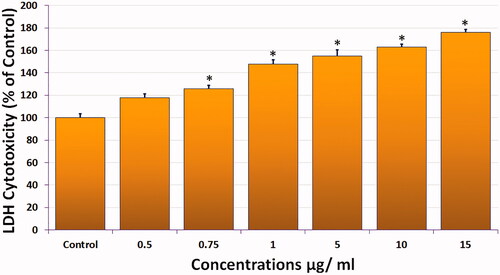
Figure 4. Phase contrast inverted microscope images of HeLa cells showing changes in the morphology of compound 1 treated cells. (A) Untreated control (B) 0.5 µg/mL (C) 0.75 µg/mL. Magnification: 100×.
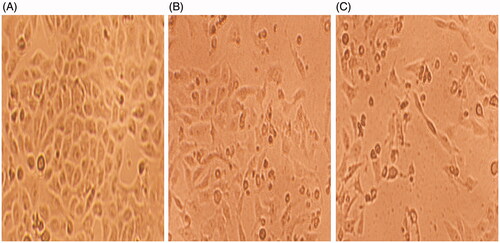
Figure 5. Apoptosis detection by annexin V-FITC/PI staining of HeLa cells analyzed by flow cytometry showing percentage of viable cells, early apoptosis, late apoptosis and necrotic cells. (A) Control (B) 0.5 µg/mL, and (C) 0.75 µg/mL.
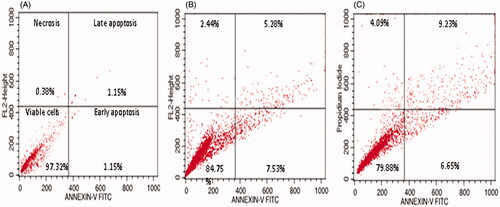
Figure 6. Dual staining with acridine orange and ethidium bromide for the analysis of apoptotic morphological changes in HeLa cells induced by compound 1 and observed under fluorescence microscopy. (A) Control (B) 0.5 µg/mL, and (C) 0.75 µg/mL. Magnification: 200×. (D) Quantification of apoptotic and necrotic cells based on the uptake of acridine orange and ethidium bromide in more than 300 cells. All data are expressed as mean ± SE. *Significant p < 0.05 compared with corresponding controls.
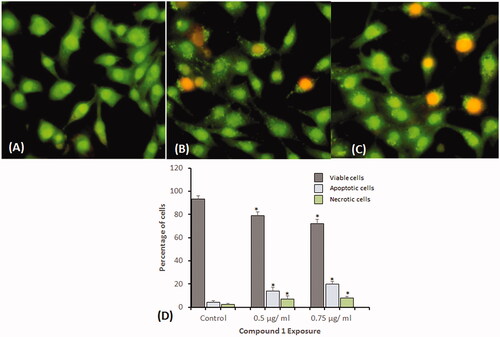
Figure 7. Mitochondrial membrane potential (MMP) analysis in HeLa cells exposed to compound 1 for 24 h and stained with Rhodamine 123. (A) Control (B) 0.5 µg/mL, and (C) 0.75 µg/mL.
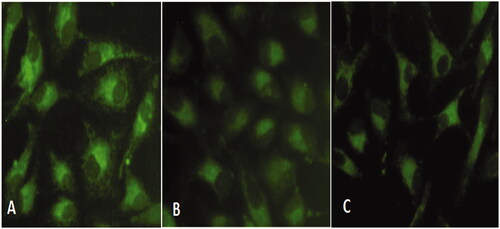
Figure 8. DNA-damage analysis in HeLa cells by comet assay after treatment with compound 1 for 24 h. Representative images of comets are shown. (A) Control (B) 0.5 µg/mL, and (C) 0.75 µg/mL, and (D) Measurement of comet tail length presented as mean ± SE from three independent experiments. *Significant, p < 0.05.
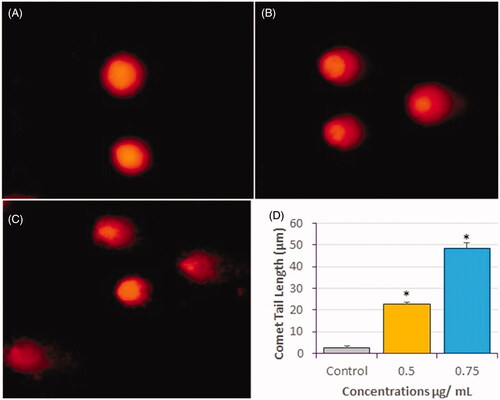
Figure 9. Interaction between compound-1 and PLK-1 kinase domain. (A) Molecular docking of compound 1 to the catalytic site of PLK-1, and (B) Amino acid residues of PLK-1 interacting with compound 1.
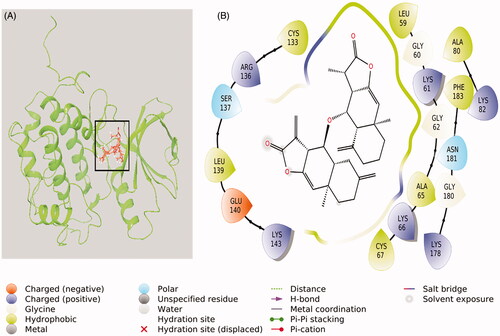
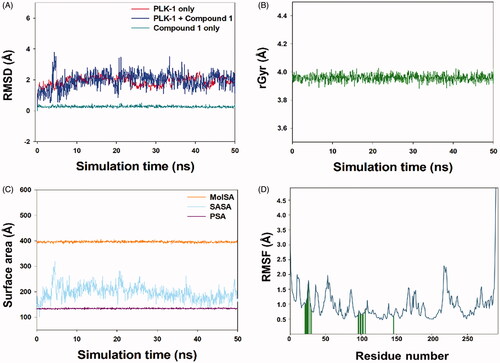
Figure 10. Molecular dynamics simulation of compound 1 and PLK-1. (A) RMSD plot of compound 1-PLK-1 complex as function of simulation time, (B) variation in the radius of gyration (rGyr) of compound 1, (C) Variation in molecular surface area (MolSA), solvent accessible surface area (SASA), and polar surface area (PSA) of compound 1 and PLK-1 complex as a function of simulation time, and (D) RMSF variations of PLK-1 interacting with compound 1.