Figures & data
Figure 1. Experiment design. DSS: dextran sulphate sodium; EDT: eriodictyol; Cyc: cyclopamine.
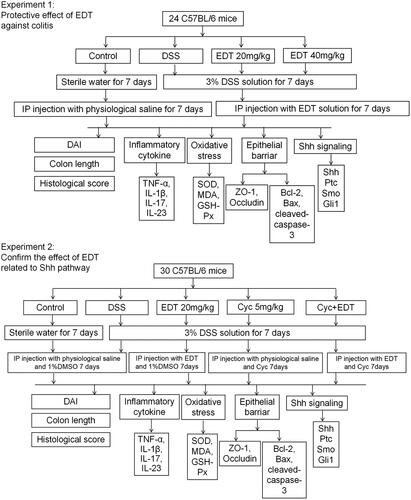
Table 1. Primer sequences for RT-PCR.
Figure 2. Effect of EDT on disease activity and histological damage in mice with DSS-induced colitis. (A) Body weights recorded in the experimental period. (B) Body weight loss was reported in grams. (C) The DAI score. (D) Representative macroscopic images of colon tissues from mice in each group. (E) Colon length. (F) The histopathology score. (G) Representative images of the colonic sections stained with H&E (magnification × 200, scale bars = 50 µm). The results are presented as means ± S.D. (n = 6). DSS: dextran sulphate sodium; EDT: eriodictyol; *p < 0.05 and **p < 0.01 compared with the DSS model group.
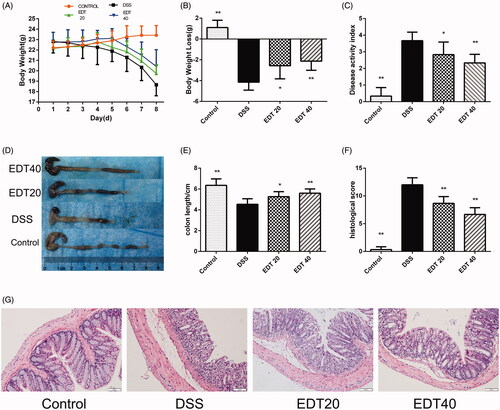
Figure 3. The EDT treatment suppresses the increased expression of pro-inflammatory cytokines in mice with DSS-induced colitis. The effect of EDT on TNF-α (A), IL-1β (B), IL-17 (C), and IL-23 (D) levels in colon tissues was measured using RT-PCR. All data are presented as means ± S.D. (n = 6). DSS: dextran sulphate sodium; EDT: eriodictyol; *p < 0.05 and **p < 0.01 compared with the DSS model group.
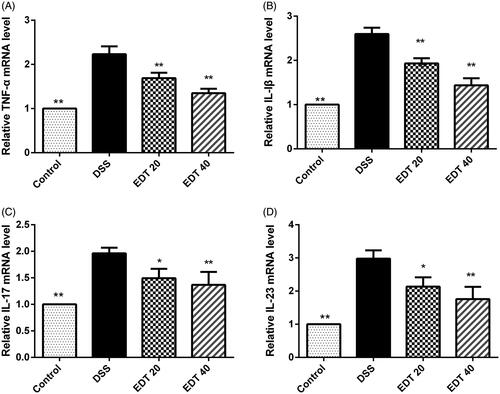
Figure 4. EDT protects against barrier disruption and improves oxidative stress in the colon. (A-B) Levels of the TJ proteins ZO-1 and occludin were assessed using Western blot analyses. (C-D) Levels of Bax, cleaved caspase 3, and Bcl-2 were measured using Western blot analyses. (E) The MDA content, (F) SOD activity, (G) GSH-Px activity were determined in colon tissues. All data are presented as means ± S.D. (n = 6). DSS:: dextran sulphate sodium; EDT: eriodictyol; *p < 0.05, **p < 0.01 compared with the DSS model group.
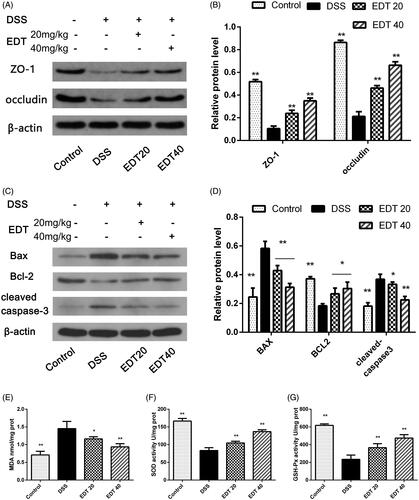
Figure 5. EDT increases the activation of the Shh pathway in mice with DSS-induced colitis. (A-D) Levels of the Ptc, Shh, Smo, and Gli1 mRNAs were measured using RT-PCR. (E-F) Levels of the Shh, Ptc, Smo, and Gli1 proteins were determined using Western blot analysis. All data are presented as means ± S.D. (n = 6). DSS: dextran sulphate sodium; EDT: eriodictyol; *p < 0.05 and **p < 0.01 compared with the DSS model group.
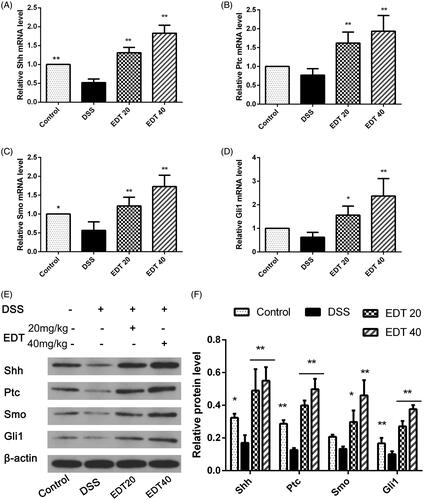
Figure 6. Cyc aggravates DSS-induced colitis. (A) Body weights recorded in the experimental period. (B) Body weight loss was reported in grams. (C) The DAI score. (D) Representative macroscopic images of colon tissues. (E) Colon length. (F) The histopathology score. (G) Representative images of the colonic sections stained with H&E (magnification × 200, scale bars = 50 µm). Data are presented as means ± S.D. (n = 6). DSS: dextran sulphate sodium; EDT: eriodictyol; Cyc: cyclopamine; *p < 0.05 and **p < 0.01 compared with the DSS group; #p < 0.05 and ##p < 0.01 compared with the EDT + Cyc group.
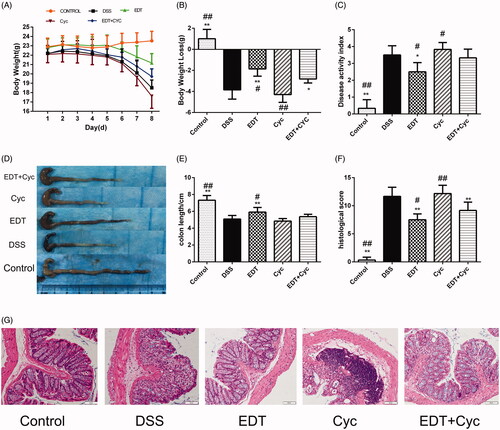
Figure 7. Cyc reverses the effect of EDT on the inflammatory response in mice with DSS-induced colitis. The levels of (A) TNF-α, (B) IL-1β, (C) IL-17, and (D) IL-23 in colon tissues were measured using RT-PCR. Data are presented as means ± S.D. (n = 6). DSS: dextran sulphate sodium; EDT: eriodictyol; Cyc: cyclopamine; *p < 0.05 and **p < 0.01 compared with the DSS group; #p < 0.05 and ##p < 0.01 compared with the EDT + Cyc group.
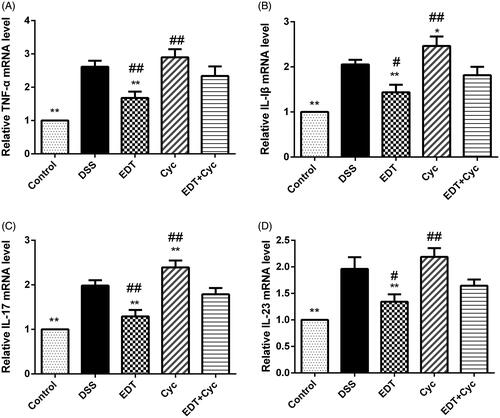
Figure 8. Cyc partially reverses the protective effect of EDT on barrier disruption and its effect on oxidative stress. (A–B) Levels of ZO-1 and occludin were determined using Western blot analyses. (C-D) Levels of Bax, cleaved caspase 3, and Bcl-2 were determined using Western blot analyses. (E) The MDA content, (F) SOD activity, and (G) GSH-Px activity were determined in the colon tissues. Data are presented as means ± S.D. (n = 6). DSS: dextran sulphate sodium; EDT: eriodictyol; Cyc: cyclopamine; *p < 0.05 and **p < 0.01 compared with the DSS group. #p < 0.05 and ##p < 0.01 compared with the EDT + Cyc group.
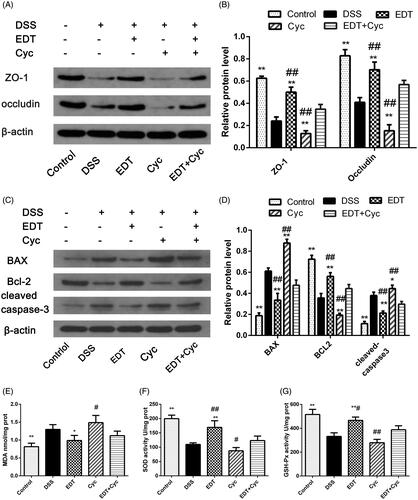
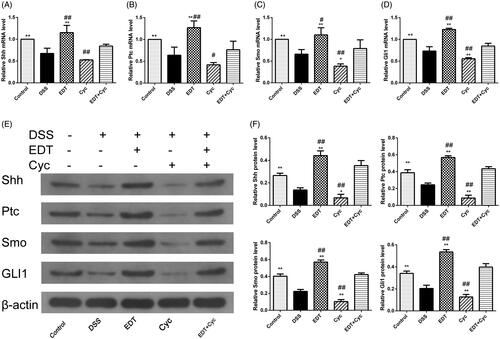
Figure 9. Cyc blocks the activation of the Shh pathway in mice with DSS-induced colitis. (A-D) Levels of the Shh, Ptc, Smo, and Gli1 mRNAs were measured using RT-PCR. (E-F) Levels of the Shh, Ptc, Smo, and Gli1 proteins were determined using Western blot analyses. Data are presented as means ± S.D. (n = 6). DSS: dextran sulphate sodium; EDT: eriodictyol; Cyc: cyclopamine. *p < 0.05 and **p < 0.01 compared with the DSS group. #p < 0.05 and ##p < 0.01 compared with the EDT + Cyc group.