Figures & data
Figure 1. Bioactive constituent from crude cucumber extract (CCE) stimulates apical Cl- conductance without altering CFTR conductance. (A) Summarised data showing Isc stimulation by crude aqueous extract at different concentrations (mg/mL). Values are means ± S.E. n = 3–5. One-way ANOVA with Holm-Sidak’s multiple-comparisons test was used to compare mean values of different dose of CCE effect against baseline and between doses as indicated. (B) Apical (AP), but not basolateral (BL) additions of CCE (0.4 mg/mL) induced increases in Isc. T84 cells grown on filters were mounted in Ussing chambers and exposed to CCE as indicated and then forskolin (FSK) was added after a steady state had been reached. CFTR-inh172 inhibits forskolin but not CCE stimulated Isc. Inset: Summary data showing average ΔIsc recorded under various conditions (n = 5). (C) CCE responses in nystatin-permeabilized monolayers. T84 monolayers were treated with basolateral nystatin and in the presence of an apical to basolateral chloride gradient under voltage clamp condition; CCE induced an apical Cl- current ICl. The inset shows the average current induced by CCE (n = 3). (D) Summary data depicting average CCE stimulated ΔICl in presence and absence of CFTRinh-172. (E) Representative record showing recovery of the response of a T84 cell monolayer exposed to CCE after washing out the extract. Inset, summarised data showing the recovery of Isc response after second application of CCE after wash. Statistical significance in B, C, D, and E determined with paired t-test. NS: not statistically significant.
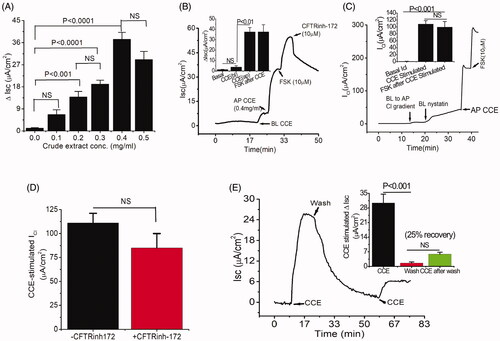
Figure 2. Separation of an active fraction of the CCE and its effect on apical Cl- conductance in T84 cells. (A) Preparative HPLC chromatogram showing fractions from CCE using water-acetonitrile gradient elution. (B) Response to cumulative addition of purified CCE fraction on nystatin-permeabilized T84 monolayers in the presence of a basolateral to apical chloride gradient; the CCE-induced Cl- current was inhibited by an apical application of the non-specific CaCC blocker DIDS (100 μM). This record is representative of two independent experiments; UC stands for untreated control. Inset, kinetics of HPLC-purified CCE stimulated ICl in T84 cells showing EC50 is 0.06 µg/ml. (C) Time-of-flight high resolution mass spectral scan of the purified fraction (HPLC fraction #2), revealed a CCB-like entity with a prominent protonated molecular ion at m/z 513.0740. Inset shows the expanded region of interest. (D) Suggested 2 D structure for the bioactive CCB-like compound corresponding to the elemental formula C31H44O6 (PubChem CID 58599137).
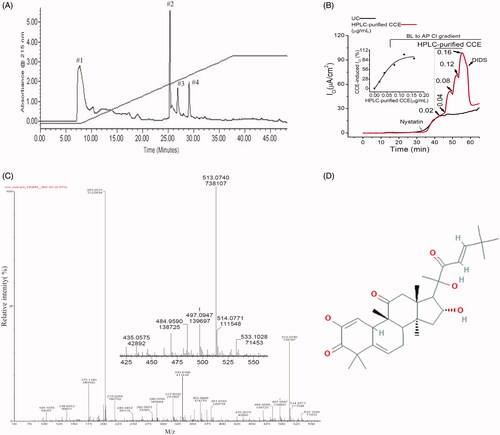
Figure 3. CCE activates TMEM16A mediated current in Xenopus laevis oocytes and releases intracellular calcium in human epithelial cells. (A) Whole cell currents in Xenopus oocytes held at −40 mV and subjected to +20 mV voltage steps before (left) and after (right) the addition of the bioactive HPLC fraction of CCE (0.12 μg/mL). (B) Current voltage relation of whole cell currents in oocytes. Current density at the end of the traces (A) were averaged and plotted against membrane potential. Data (± SEM, n = 5, evaluated with t-test, *p < .0001). CCE (red plot) activates current with outward rectification and amplitudes consistent with the well characterized TMEM16A channel endogenous to Xenopus oocytes. (C) The activation of the TMEM16A currents by the CCE is transitory, as evident by declining outward current amplitudes at +60 mV over time and the instantaneous tail currents at – 40mV. (D) Measuring relative changes in intracellular Ca2+ in human bronchial epithelial cells (IB3-1) with CCE and without (n = 3 cover slips and 32 cells for each) in zero Ca2+ bath using Fura-2. ΔF/F is the measured F340/F380 ratio normalized to the initial F measurement (see methods). CCE significantly increased intracellular Ca2+ as determined by Two-way ANOVA, p<0.0001).
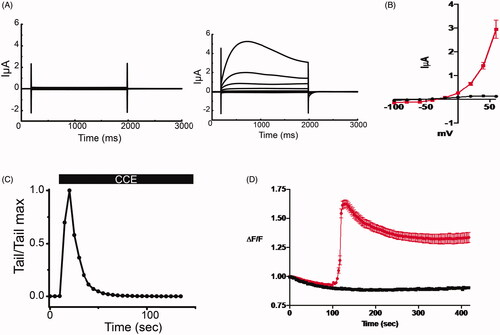
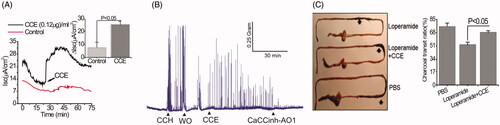
Figure 4. Stimulation of Cl- secretion and smooth muscle contraction by CCE in mouse intestinal tissue. (A) Representative data showing the effect of partially purified CCE on Isc change in wild type mouse (C57BL/6) colonic tissue (n = 4). The inset shows summary data from four independent experiments. Data are means ± S.E. (B) Representative traces showing the effect of CCE on smooth muscle contraction in isolated mouse colon and its inhibition by CaCCinh-A01 (n = 3). (C) Representative image of isolated mouse intestinal tracts showing movement of activated charcoal after oral gavage of PBS (positive control), Loperamide in the presence or absence of CCE. Bar graph showing a summary of the % charcoal transit ratio under the three conditions tested. Data are the means ± S.E of three independent experiments.