Figures & data
Figure 1. The pathological analysis of lung sections and determination of biochemical indicators in all groups. (A) Representative photomicrographs of the H&E staining and Masson staining (Images magnification: all picture 200×). (B) Result of HYP, SOD, MDA and mean histological scores. The degree of severity was assigned the following scores: 0, no evidence of fibrosis; 1, focal regions of fibrosis involving less than 20% of the lung; 2, 20–50% of the lung and fibrotic regions; 3, 51–75% of the lung and fibrotic regions; and 4, focal regions of fibrosis involving more than 75% of the lung. All values represent the mean ± SD. Statistical significance was calculated with ANOVA. #p < 0.05, ##p < 0.01 compared to the control group; *p < 0.05, ** p < 0.01 compared to the model group.
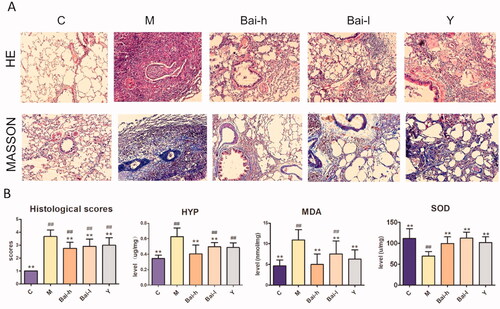
Table 1. The analysis results from determination of SOD, MDA, HYP and histlogical scores (mean ± SD).
Figure 2. The PLS-DA score plots of serum samples analysed in positive (A) and negative (B) ion models from all groups; OPLS‑DA score plots of serum samples analysed in positive (C) and negative (D) ion models comparing pulmonary fibrosis metabolite profiles from the control to those from the model group; S-plots constructed from the OPLS-DA of serum samples in positive (E) and negative (F) ion models.
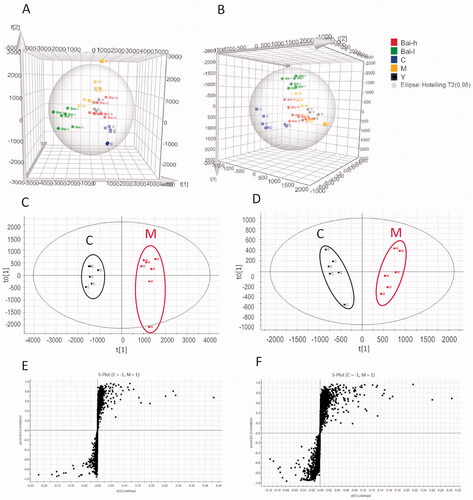
Figure 3. Analysis of the identified differential metabolites. (A) Heatmap of the differential abundance of metabolites in the control and model groups. (B) Heatmap of the differential abundance expression levels and associated p-values for the control, low and high doses of baicalin vs model groups. Statistical significance was calculated with Student’s t-test.
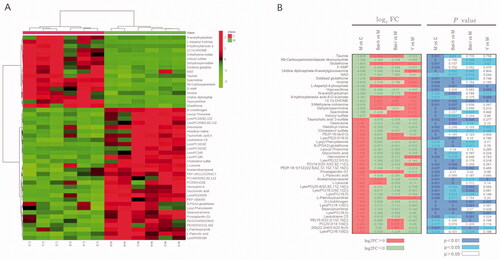
Table 2. The results of the identified differential metabolites from the control and model groups.
Figure 4. Analysis of related metabolic pathways and crucial biomarkers. (A) Metabolism pathway analysis of serum samples with MetPA, as analyzed by MetaboAnalyst (http://www.metaboanalyst.ca/MetaboAnalyst/). The size and colour of each circle were based on the pathway impact value and p-value, respectively. (B) ROC curves of the diagnosis of RF based on the selected crucial biomarkers. AUC, area under the curve. (C) Change trends of eight key biomarker relative intensities in different groups for pulmonary fibrosis. *p < 0.05, **p < 0.01.
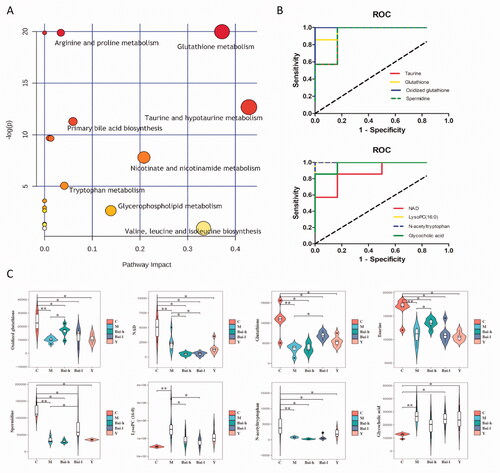
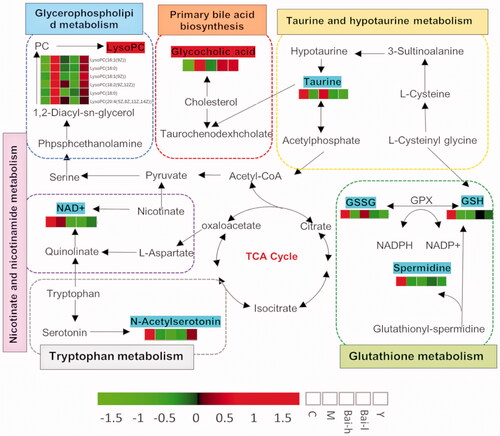
Figure 5. Network of the identified key biomarkers, pathways and the main target of baicalin action according to the KEGG pathway database. The metabolites coloured blue or red represent decreasing or increasing levels, respectively, in the M group compared with the C group.