Figures & data
Table 1. Primer sequence of real-time PCR of mouse prostate tissue.
Table 2. Primer sequence of real-time PCR of BPH-1.
Figure 1. The effect of curcumin on prostate size and expression of inflammatory cytokines in mice. (A) Representative images of the size of mouse prostate in each group. (B) Representative images of different tissues stained with H&E (top panel: 200× magnification, bar = 50 μm; bottom panel: 400× magnification, bar = 50 μm). (C,D) PCR and western blotting analyses of TNF-α and IL-6 in primary mice prostate epithelial cells. *p < 0.05. (E) Representative images of different tissues dyed with Masson's trichrome staining (top panel: 200× magnification, bar = 50 μm; bottom panel: 400× magnification, bar = 50 μm).
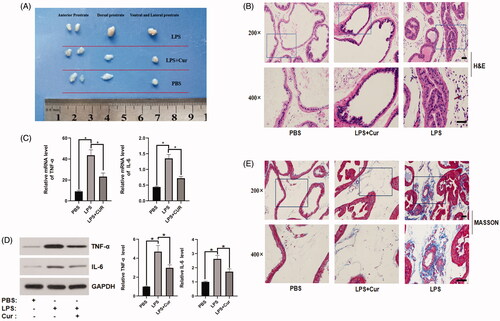
Figure 2. The effect of curcumin on the expression of E-cadherin and vimentin in the LPS-induced BPH mouse model (n = 8). (A,B) Protein and mRNA expression of E-cadherin and vimentin. *p < 0.05.
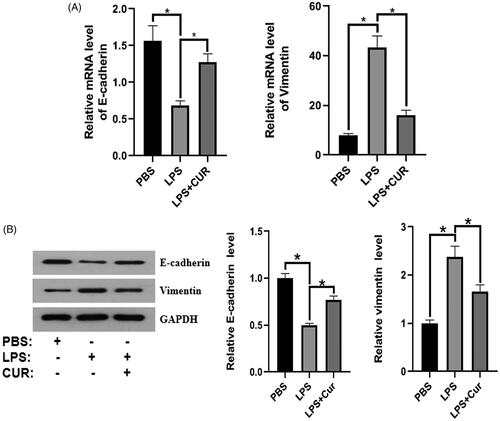
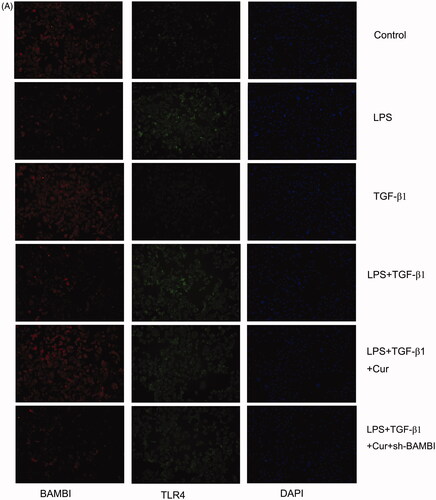
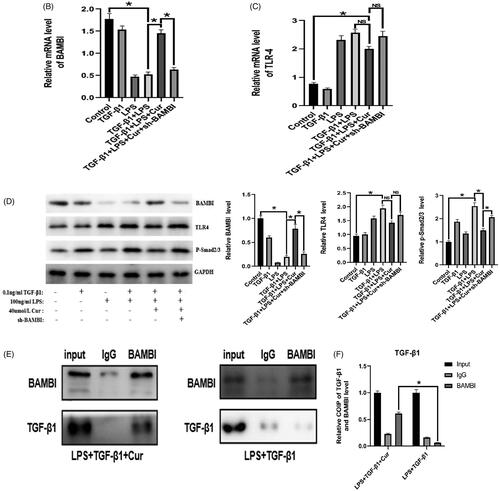
Figure 3. Effect of curcumin on the expression of BAMBI, TLR4, and TGF-β1 in the LPS-induced BPH mouse model (n = 8). (A) The expression of BAMBI in different groups, detected by immunohistochemistry (top panel: 200× magnification, bar = 50 μm; bottom panel: 400× magnification, bar = 50 μm). (B) The expression of TLR4 in various groups, as evidenced by immunohistochemistry (top panel: 200× magnification, bar = 50 μm; bottom panel: 400× magnification, bar = 50 μm). (C,D) mRNA and protein expression of BAMBI and TGF-β1 in each group, respectively (n = 8). (E,F) mRNA and protein expression level of TLR4 in each group. *p < 0.05.
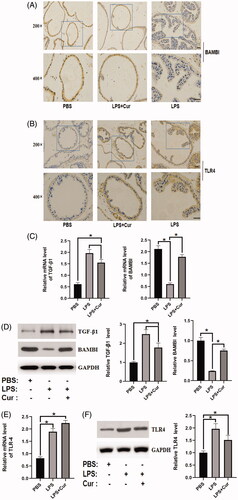
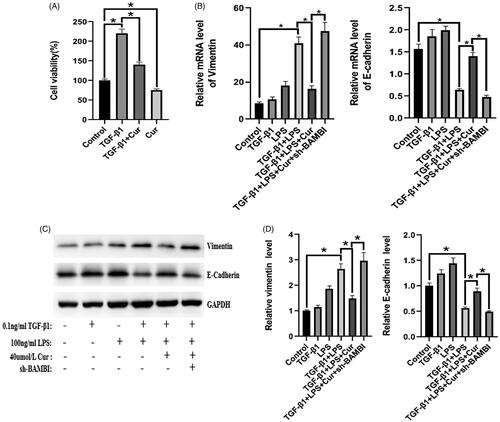
Figure 4. The effect of curcumin on the expression of E-cadherin and vimentin in BPH-1 cells. (n = 8). (A) Viability of BPH-1 cells under different treatments. (B–D) mRNA and protein expression of E-cadherin and vimentin in BPH-1 cells in each group, respectively. *p < 0.05.