Figures & data
Figure 1. Effect of lipopolysaccharide (LPS) or oxidized low-density lipoprotein (oxLDL) at different concentrations on the expression of ICAM-1 in HUVECs. (A) Confocal microscopic data of HUVECs treated with LPS at different concentrations (0, 0.1, 0.5, 1, and 10 µg/mL, respectively). Upper panel: representative confocal images; lower panel: quantification of the mean fluorescence intensity (MFI). (B) Flow cytometric data of LPS-treated HUVECs. Left panel: representative flow cytometric data; right panel: quantification of the mean fluorescence. (C) Confocal microscopic data of HUVECs treated with oxLDL at different concentrations (0, 5, 25, 50, and 100 µg/mL, respectively). (D) Flow cytometric data of oxLDL-treated HUVECs. **p < 0.01; ***p < 0.001; ****p < 0.0001 compared with the control (n = 3).
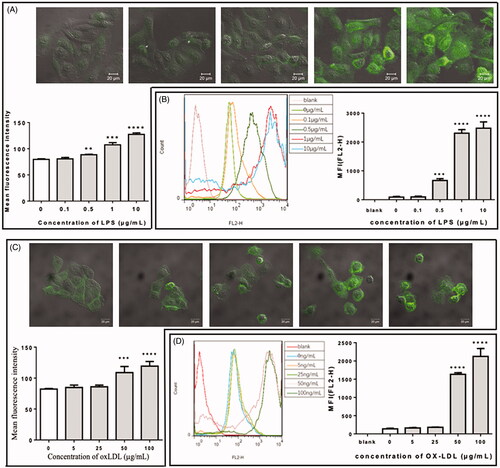
Figure 2. Effect of MβCD on the viability of HUVECs detected by MTT assay. Left: the cells were treated with MβCD at different concentrations (0–100 mM as indicated) for 1 h; right: the cells were treated with 5 mM MβCD for different periods of time (0, 1, 2, 4, and 8 h, respectively). *p < 0.05; **p < 0.01 compared with the control (left: n = 3; right: n = 4); ***p < 0.001; ****p < 0.0001.
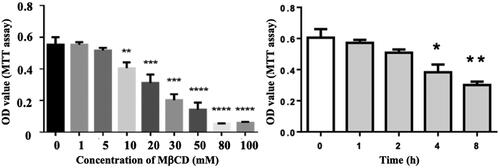
Figure 3. Inhibitory effect of MβCD on the LPS-induced expression of adhesion molecules in HUVECs. Four groups are categorized: HUVECs without treatment (control), treated with MβCD only (at 5 mM at 37 °C for 1 h), with LPS only (at 1 µg/mL at 37 °C for 12 h), and with both LPS and MβCD, respectively. (A) Confocal microscopic imaging of ICAM-1 molecules on cell surfaces (upper panel: representative confocal images; lower panel: quantification of MFI). (B) Flow cytometric detection of ICAM-1 molecules in cells (left panel: representative flow cytometric data; right panel: quantification of MFI). (C) The detection of ICAM-1 mRNA expression in cells. Left panel: agarose gel electrophoretic image; right panel: quantification of relative mRNA expression (ratio of ICAM-1 to GAPDH). (D) Representative confocal microscopic images of fluorescently stained VCAM-1 molecules on cell surfaces. From left to right: control, MβCD only, LPS only, and LPS + MβCD, respectively. (E) Quantification of VCAM-1 MFI. ***p < 0.001; ****p < 0.0001 compared with the corresponding group (n = 5 in A; n = 3 in B,C,E).
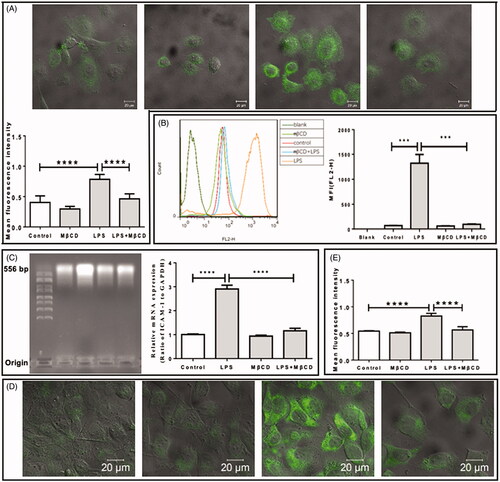
Figure 4. Inhibitory effect of MβCD on the oxLDL-induced expression of adhesion molecules in HUVECs. Four groups are categorized: HUVECs without treatment (control), treated with MβCD only (at 5 mM at 37 °C for 1 h), with oxLDL only (at 50 µg/mL at 37 °C for 12 h), and with both oxLDL and MβCD, respectively. (A) Confocal microscopic imaging of ICAM-1 molecules on cell surfaces (upper panel: representative confocal images; lower panel: quantification of MFI). (B) Flow cytometric detection of ICAM-1 molecules in cells (left panel: representative flow cytometric data; right panel: quantification of MFI). (C) The detection of ICAM-1 mRNA expression in cells. Left panel: agarose gel electrophoretic image; right panel: quantification of relative mRNA expression (ratio of ICAM-1 to GAPDH). (D) Representative confocal microscopic images of fluorescently stained VCAM-1 molecules on cell surfaces. From left to right: control, MβCD only, oxLDL only, and oxLDL + MβCD, respectively. (E) Quantification of VCAM-1 MFI. *p < 0.05; ***p < 0.001; ****p < 0.0001 compared with the corresponding group (n = 5 in A; n = 3 in B,C,E).
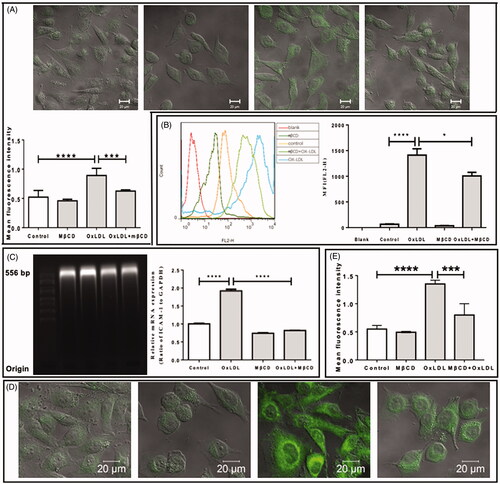
Figure 5. MβCD reverses the LPS- or oxLDL-induced changes in the contents of signal pathway key molecules in HUVECs detected by western blotting. (A) Western blots of P65 (a subunit of NF-κB), phosphorylated P65 (pP65), and IKK, respectively. Three groups are categorized: HUVECs without treatment (control), treated with LPS only (at 1 µg/mL at 37 °C for 12 h), and with both LPS and MβCD, respectively. (B) Western blots of P65, pP65, Akt, and phosphorylated Akt (p-AKT), respectively. Three groups are categorized: control, oxLDL only (at 50 µg/mL at 37 °C for 12 h), and oxLDL + MβCD, respectively.
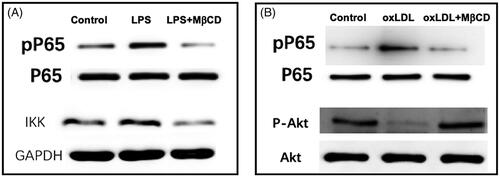
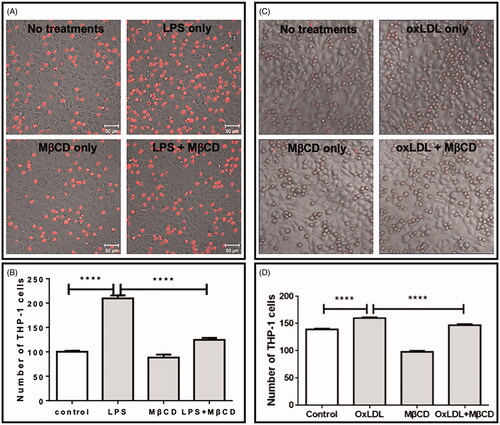
Figure 6. Inhibitory effect of MβCD on the monocyte-endothelial adhesion induced by LPS (A,B) or by oxLDL (C,D). The cells were treated without (control) or with LPS only (at 1 µg/mL at 37 °C for 12 h) or oxLDL only (at 50 µg/mL at 37 °C for 12 h), MβCD only (at 5 mM at 37 °C for 1 h), and LPS/oxLDL + MβCD, respectively. (A, C) Representative confocal images of fluorescently (CellTracker Red CMTPX) stained THP-1 monocytes on the monolayer of HUVECs. (B,D) Average numbers of THP-1 cells adhered on the endothelial cell monolayer in a field with the same size (****p < 0.0001 compared with the corresponding group; n = 4).