
Figures & data
Table 1. Plants used for the Huoxue Qianyang Qutan recipe.
Table 2. Primer sequences.
Figure 1. Effects of HQQR on liver and body weight, SBP, HR, and Lee’s index. (A) Changes in liver and body weight after HFD exposure for 10 weeks. (B) SBP among the different groups of rats, measured every 2 weeks of treatment, for 10 weeks. (C) Comparison of HR among the different groups after 10 weeks of treatment. (D) Comparison of Lee’s index between different groups after 10 weeks of treatment. *p < 0.05 vs. WKY group; #p < 0.05 vs. SHR group; ▲p < 0.05 vs. OBH group; ⋄p < 0.05 vs. OBH + HQQR(L) group.
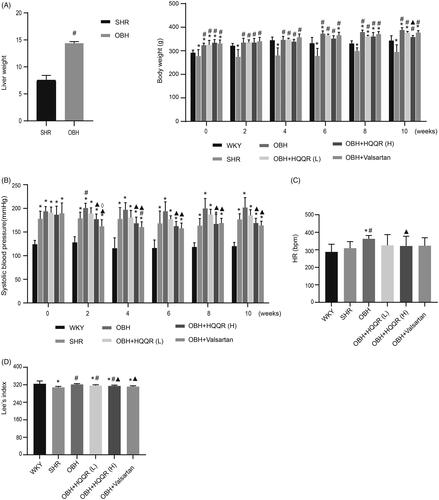
Figure 2. (A) Morphological change of OBH rats compared with SHR rats after HFD exposure for 10 weeks. (B) Different sizes and colours of livers compared with SHR rats after 10 weeks of HFD exposure.
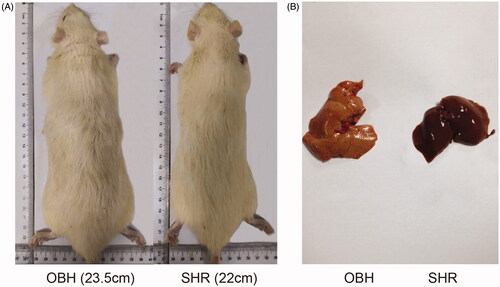
Figure 3. HQQR alleviated LVH in OBH rats. (A) Measurements of heart weight/body weight (HW/BW), heart weight/tibia length (HW/TL), and left ventricle mass/body weight (LVMI) after 10 weeks of treatment. (B) Representative images of cardiac echocardiography after 10 weeks of treatment. (C) Left ventricular mass (LVM-cor), interventricular septal thickness (IVSD), left ventricular internal diameter at end-diastole (LVIDd) and left ventricular posterior wall thickness in diastole (LVPWd). *p < 0.05 vs. WKY group; #p < 0.05 vs. SHR group; ▲p < 0.05 vs. OBH group; ⋄p < 0.05 vs. OBH + HQQR(L) group.
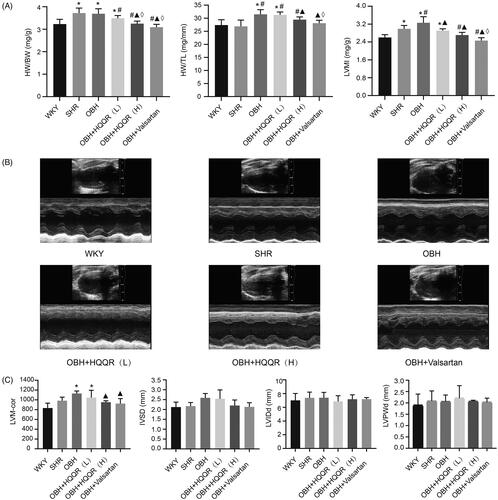
Figure 4. HQQR treatment alleviated myocardial fibrosis. (A) Representative photomicrographs of HE, Masson’s staining, and IHC (Col I and Col III) of the myocardium of rats. (B) The area of fibrosis in the myocardium was calculated using the Image J software. (C) The area of Col I in the myocardium was calculated using the Image J software. (D) The area of Col III in the myocardium was calculated using the Image J software. *p < 0.05 vs. WKY group; #p < 0.05 vs. SHR group; ▲p < 0.05 vs. OBH group; ⋄p < 0.05 vs. OBH + HQQR(L) group; Δp < 0.05 vs. OBH + HQQR(H) group.
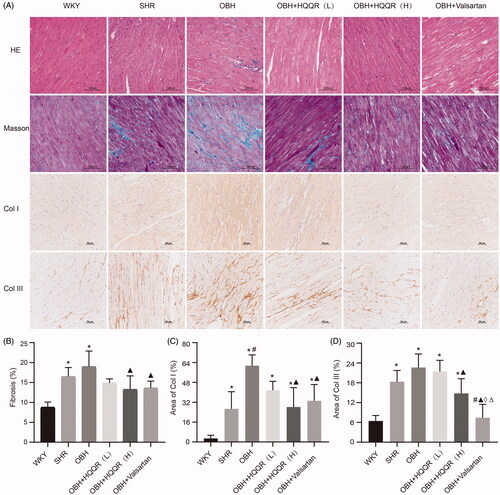
Figure 5. HQQR inhibited the proliferation of CFs and reduced Hyp levels. (A) The proliferation of CFs with different concentrations of HQQR. (B) Effects of HQQR and caspase-1 inhibitor on the proliferation of CFs, measured using the CCK-8 assay. (C) The effects of HQQR and caspase-1 inhibitor on Hyp levels. (D) HQQR and caspase-1 inhibitor effects on the density of α-SMA measured immunofluorescence staining under a laser scanning confocal microscope. (E) Area intensity of α-SMA was quantified by image J. *p < 0.05 vs. control group; #p < 0.05 vs. Ang II group; ▲p < 0.05 vs. HQQR(L) group; ⋄p < 0.05 vs. HQQR(H) group; Δp < 0.05 vs. valsartan group.
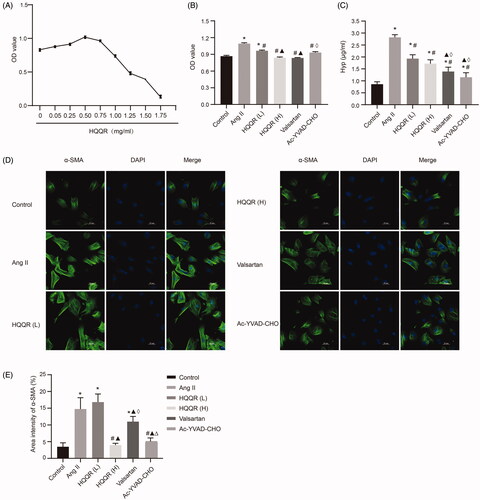
Figure 6. NLRP3 played an important role in the HQQR mediated effect of cardiac fibrosis inhibition. (A) Validation of mRNA and protein expression of NLRP3. (B) Effects of si-NLRP3 and oeNLRP3 on the proliferation of CFs, measured using the CCK8 assay. (C) Effects of si-NLRP3 and oeNLRP3 on Hyp expression. (D,E) The density of α-SMA was observed by immunofluorescence staining under a laser scanning confocal microscope. Area intensity of α-SMA was quantified by image J. *p < 0.05 vs. control group; ◊p < 0.05 vs. Ang II + Opti-men group; ▼p < 0.05 vs. si-NLRP3 group; ‡p < 0.05 vs. vector + HQQR group.
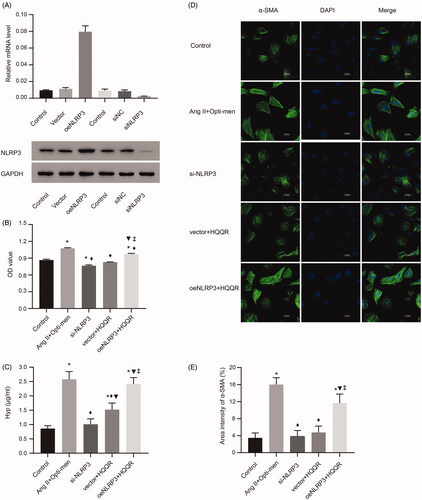
Figure 7. HQQR attenuated CF fibrosis via the NLRP3 inflammasome. (A) The protein expression of Col I and Col III was analyzed by western blotting. (B) The expression of IL-1β in the supernatant of the different groups of CFs. (C) The mRNA expression of NLRP3, caspase-1, and IL-1β was analyzed by western blotting. (D) The relative protein expression levels of NLRP3, caspase-1, and IL-1β among the different groups were quantified using the Image J software. *p < 0.05 vs. control group; #p < 0.05 vs. Ang II group; ▲p < 0.05 vs. HQQR(L) group; ⋄p < 0.05 vs. HQQR(H) group; ♦p < 0.05 vs. Ang II + Opti-men group; ▼p < 0.05 vs. si-NLRP3 group; ‡p < 0.05 vs. vector + HQQR group.
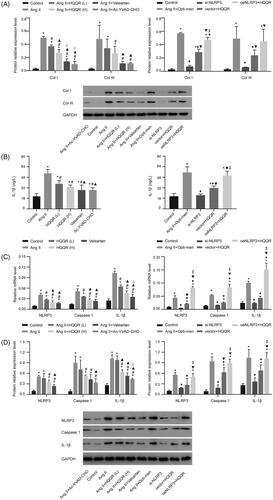
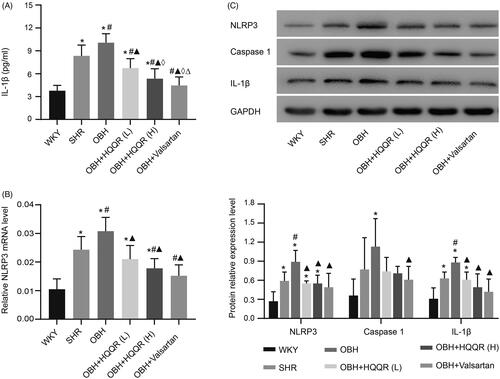
Figure 8. HQQR could reduce the expression of NLRP3 and IL-1β protein in the rat myocardium. (A) Expression of IL-1β in the serum in different groups measured by ELISA. (B) The relative NLRP3 mRNA levels were quantified by RT-PCR. (C) NLRP3, caspase-1, and IL-1β protein expression was analyzed by western blotting and quantified. *p < 0.05 vs. WKY group; #p < 0.05 vs. SHR group; ▲p < 0.05 vs. OBH group; ⋄p < 0.05 vs. OBH + HQQR(L) group; Δp < 0.05 vs. OBH + HQQR(H) group.
Data availability statement
All data generated or analyzed during this study are included in this published article.