
Figures & data
Figure 1. HPLC fingerprint graph of JWSNS. The HPLC fingerprint graph of JWSNS showed 31 common characteristic peaks: one peak (1) belonged to Rehmannia glutinosa; one peak (7) belonged to Lycium barbarum L.; eight peaks (3, 4, 5, 6, 9, 10, 20, 23 and 25) belonged to Gardenia jasminoides Ellis; eight peaks (2, 8, 12, 13, 14, 16, 20 and 27) belonged to Paeonia lactiflora; 14 peaks (11, 15, 17, 18, 19, 20, 21, 22, 24, 26, 28, 29, 30 and 31) belonged to Aurantii Fructus. Compared with reference substance, peaks 10, 14, 18 and 19 were respectively identified as geniposide, paeoniflorin, naringin, hesperidin.
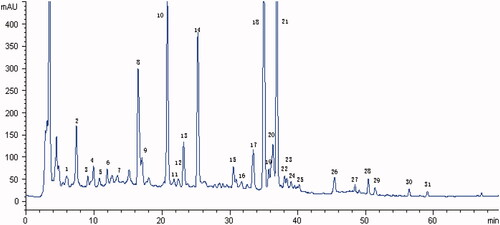
Table 1. The table of components in JiaWeiSiNiSan.
Figure 2. Experiment procedure.
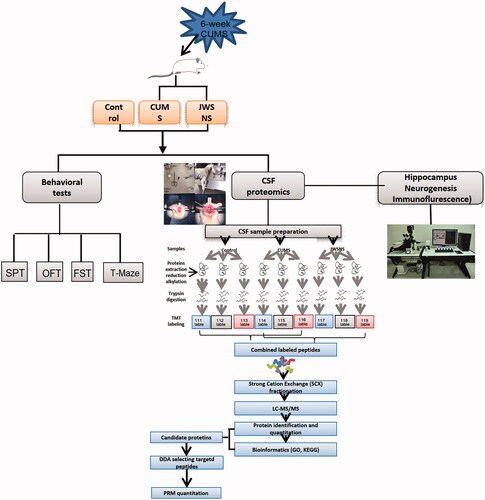
Figure 3. Behavioural test results. (A) Result of Sucrose Preference Test (SPT); (B) result of Open Field Test (OFT); (C) result of Forced Swimming Test (FST); (D) result of T-Maze. Data were expressed as the mean ± SEM, *p < 0.05, **p < 0.01, #p < 0.05, ##p < 0.01.
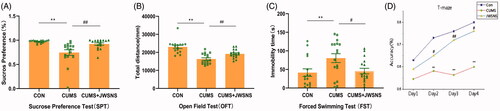
Figure 4. Amount of resilient, susceptible, non-sensitive rats of CUMS and JESNS group in Sucrose Preference Test (SPT) (A), Open Field Test (OFT) (B) and Forced Swimming Test (FST) (C); and (D) amount of rats of CUMS and JWSNS group that showed resilience in one, two and all above behavioural tests.
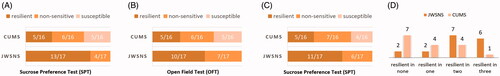
Figure 5. GO annotation and KEGG pathway enrichment analysis of Differently expressed proteins (DEPs). (A) GO annotation of DEPs in CON and CUMS group; (B) KEGG pathway enrichment analysis of DEPs in CON and CUMS group; (C) GO annotation of DEPs in CUMS and JWSNS group; (D) KEGG pathway enrichment analysis of DEPs in CUMS and JWSNS group.
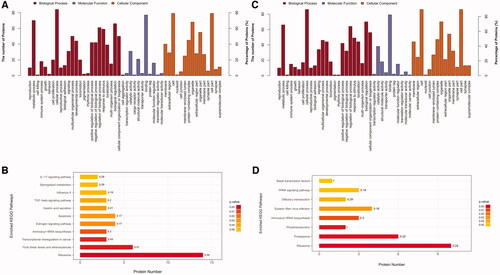
Figure 6. (A) Venn map of differentially expressed proteins co-regulated by JWSNS and CUMS; (B) Protein–Protein Interaction Network (PPI) of co-regulated DEPs.
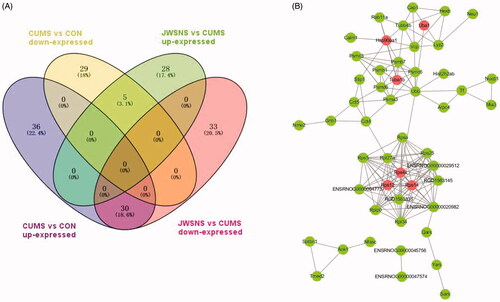
Table 2. Differentially expressed proteins co-regulated by JWSNS and CUMS.
Table 3. PRM quantitative analysis of target proteins.
Figure 7. (A) BrdU/DCX positive cells in DG, red: BrdU, green: DCX, blue: DAPI. (B) Number of BrdU/DCX positive cells in DG (n = 5 per group). Data were expressed as the mean ± SEM. *p < 0.05, **p < 0.01, vs. control. #p < 0.05, ##p < 0.01, vs. CUMS.
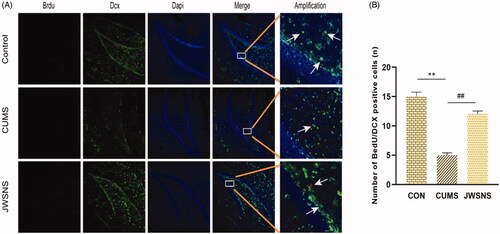
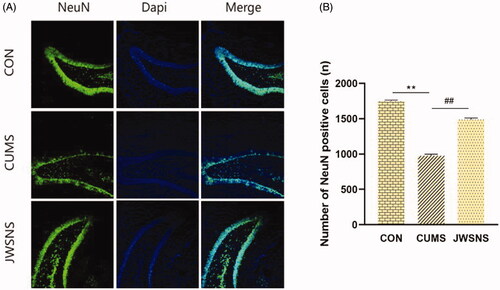
Figure 8. (A) NeuN positive cells in DG, green: NeuN, blue: DAPI. (B) Number of neurons in DG (n = 5 per group). Data were expressed as the mean ± SEM. *p < 0.05, **p < 0.01, vs. control. #p < 0.05, ##p < 0.01, vs. CUMS.
Data availability statement
The mass spectrometry proteomics data have been deposited to the ProteomeXchange Consortium via the PRIDE partner repository with the dataset identifier PXD021735. The mass spectrometry proteomics data have been also deposited to the iProX with the dataset identifier PXD021776.