
Figures & data
Table 1. RT-qPCR primers for intestinal target bacteria.
Table 2. RT-qPCR primers for gene expression.
Figure 1. The effects of faecal microbial transplantation from a Kazak individual with normal glucose tolerance on FBG (A) and PPG (B) levels in T2DM db/db mice. Data were analyzed using one-way ANOVA. ## p < 0.01 compared to db/m + PBS mice; *p < 0.05; **p < 0.01 compared to db/db + PBS mice.
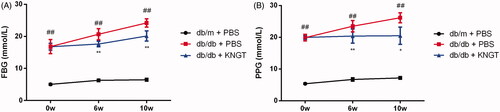
Table 3. Effect of FMT-KNGT on blood glucose levels in mice ( ± s, mmol/L).
Figure 2. The effects of faecal microbial transplantation from a Kazak individual with normal glucose tolerance on total cholesterol (TC) (A), triglycerides (TG) (B), LDL-C (C) and HDL-C (D) plasma levels in T2DM db/db mice. Data were analyzed using one-way ANOVA. ##p < 0.01 compared to db/m + PBS mice; *p < 0.05 and **p < 0.01 compared to db/db + PBS mice.
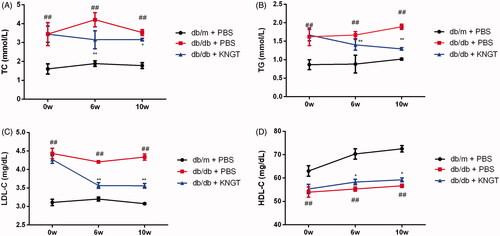
Table 4. Effect of FMT-KNGT on blood lipid levels in mice ( ± s, TC, TG: mmol/L; HDL-C, LDL-C: mg/dL).
Figure 3. Relative abundance of gut microbiota species at the genus (A) level in faecal samples from the KNGT donor. Relative abundance differences of species at the genus (B) and species (C) levels from each mouse group after FMT-KNGT. Data are presented as percentages. Data were analyzed using the Kruskal–Wallis test. For B and C, mouse faeces were tested at week 6. ‘Others’ refer to bacteria not indicated in the figure.
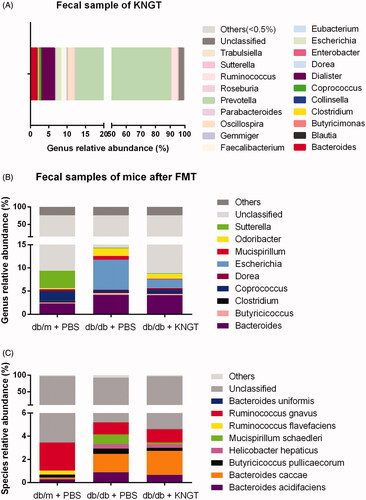
Table 5. The relative abundance of bacteria in faecal samples from the KNGT donor at the genus level (%).
Table 6. The relative abundance of the dominant bacteria in faecal samples from mice at the genus level (%, n = 6).
Table 7. The relative abundance of the dominant bacteria in faecal samples from mice at the species level (%, n = 6).
Figure 4. Quantification of gut bacteria in each group over time. SQ represents the starting template quantity of Mucispirillum schaedleri (A), Clostridium (B), Sutterella (C), Bacteroides uniformis (D), Ruminococcus gnavus (E), Bacteroides (F) and Faecalibacterium prausnitzii (G). On the horizontal axis, 0w, 6w, and 10w represent 0, 6 and 10 weeks after FMT-KNGT intervention. Data were analyzed using one-way ANOVA. #p < 0.05 and ##p < 0.01 compared to db/m + PBS mice. **p < 0.01 compared to db/db + PBS mice.
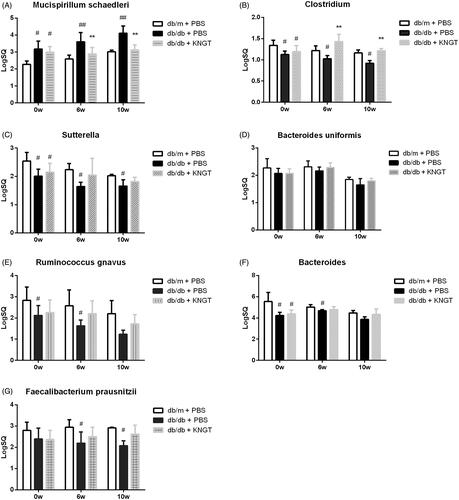
Table 8. Effect of FMT- KNGT on the levels of target bacteria in the faeces of mice by RT-qPCR ( ± s, LogSQ).
Figure 5. Gas chromatography comparisons between SCFA standards (A) and faecal samples (B) a = acetic acid, b = propionic acid, c = butyric acid, d = 2-ethyl butyric acid. SCFA data at 0, 6 and 10 weeks for faecal samples from mice after FMT-KNGT treatment (C). Data were analyzed using one-way ANOVA. *p < 0.05, **p < 0.01 compared to db/db + PBS mice.
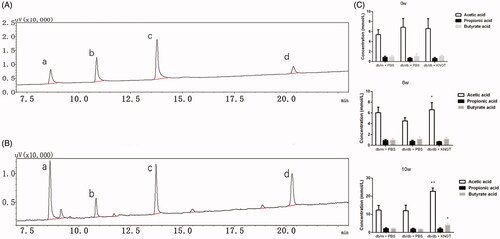
Table 9. Concentrations of acetic acid, propionic acid and butyrate acid in faecal samples of mice ( ± s, mmol/L).
Figure 6. GPR43 mRNA (A) and GLP-1 (B) levels in colon tissues from each mouse group after FMT-KNGT at 0, 6 and 10 weeks. Data were analyzed using one-way ANOVA. #p < 0.05 compared to db/m + PBS mice. *p < 0.05 compared to db/db + PBS mice.
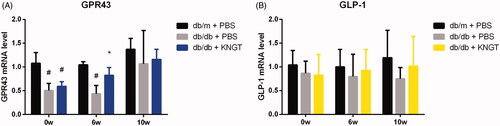
Table 10. GPR43 and GLP-1 mRNA expression in colonic tissue of mice ( ± s, n = 3).
Figure 7. GLP-1 protein expression in the colon tissue of each mouse group after FMT-KNGT at 0, 6 and 10 weeks. The grey values were analyzed by ImageJ. Data are presented as the mean ± SD values. *p < 0.05 compared to db/m + PBS mice. #p < 0.05 compared to db/db + PBS mice.
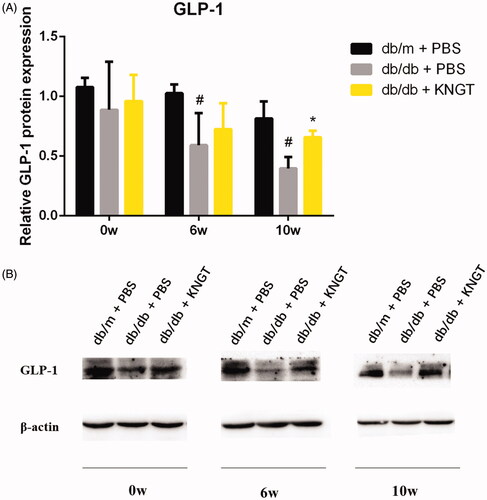
Table 11. Protein expression of GLP-1 in colonic tissue of mice ( ± s, n = 3).
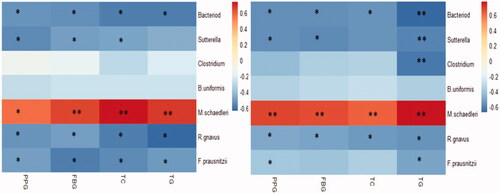
Figure 8. Correlations between faecal target bacteria and plasma glycolipid levels in three groups mice treated with FMT-KNGT for 6 weeks (A) and 10 weeks (B). R value is between 0.6∼-0.6; *p < 0.05, **p < 0.01.