Figures & data
Table 1. Primer pairs and probes used for Real-time PCR.
Figure 1. YGJ inhibits the activation of hepatic stellate cells and fibrosis. (a) Sirius red staining (×100). (b) α-SMA immunostaining (×200). (c) Col (1) immunostaining (×200). (d) Sirius Red-positive region. (e) α-SMA and Col(1) protein bands were depicted in immunoblots, and (f) the histogram is a densitometric analysis of the protein bands (n = 5 per group). (g) α-SMA, Col(1) and TGF-β mRNA expressions were measured by RT-PCR and normalized to GAPDH mRNA (n = 5 per group). **p < 0.01. N: untreated group (control); 2-AAF/CCl4: 2-acetylaminofluorene/carbon tetrachloride-treated group; YGJ: 2-AAF/CCl4 + Yiguanjian decoction-treated group; SORA: 2-AAF/CCl4 + sorafenib-treated group.
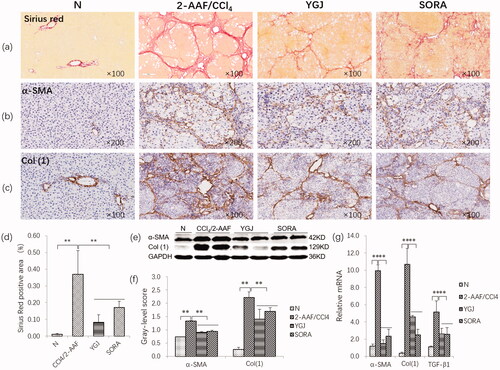
Figure 2. YGJ inhibits liver inflammation and bile duct reaction. (a) H&E staining (×200). (b) CD68 immunostaining (×200). (c) CD163 immunostaining (×200). (d) CK19 immunostaining (×200). (e) CK19 protein bands were depicted in the immunoblot images, and (f) the densitometric quantification of the protein bands presented as a histogram (n = 5 per group). (g) CD68, CD163, and TNF-α mRNA expressions were measured by RT-PCR and normalized to GAPDH mRNA (n = 5 per group). (h) Serum levels of alanine aminotransferase and aspartate aminotransferase. *p < 0.05 and **p < 0.01. N: untreated group (control); 2-AAF/CCl4: 2-acetylaminofluorene/carbon tetrachloride-treated group; YGJ: 2-AAF/CCl4 + Yiguanjian decoction-treated group; SORA: 2-AAF/CCl4 + sorafenib-treated group.
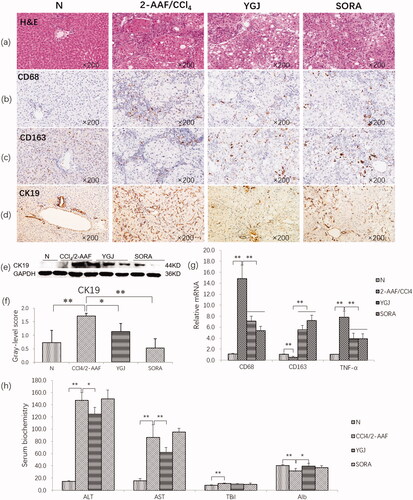
Figure 3. YGJ inhibits the activation of M1 macrophages and non-canonical Wnt signalling pathways and inhibits the differentiation of hepatic progenitor cells into myofibroblasts in vivo. (a) STAT1, IRF3, IRF5, IRF8, and SOCS3 protein bands were depicted in the immunoblot images, and (b) the densitometric quantification of the protein bands presented as a histogram (n = 5 per group). (c) The mRNA expressions of Wnt-4, -5 A, -5B, FZD-2, -3, and -6 in liver were measured by RT-PCR and normalized to GAPDH mRNA (n = 5 per group). (d) Wnt5A, Wnt5B, and FZD2 protein bands were depicted in the immunoblot images, and (e) the densitometric quantification of the protein bands presented as a histogram (n = 5 per group). (f) OV6, SOX9, EpCAM, CK19, and Hep mRNA expressions were measured by RT-PCR and normalized to GAPDH mRNA (n = 5 per group). (g) EpCAM protein bands were depicted in the immunoblot images, and (h) the densitometric quantification of the protein bands presented as a histogram (n = 5 per group). *p < 0.05 and **p < 0.01. N: untreated group (control); 2-AAF/CCl4: 2-acetylaminofluorene/carbon tetrachloride-treated group; YGJ: 2-AAF/CCl4 + Yiguanjian decoction-treated group; SORA: 2-AAF/CCl4 + sorafenib-treated group.
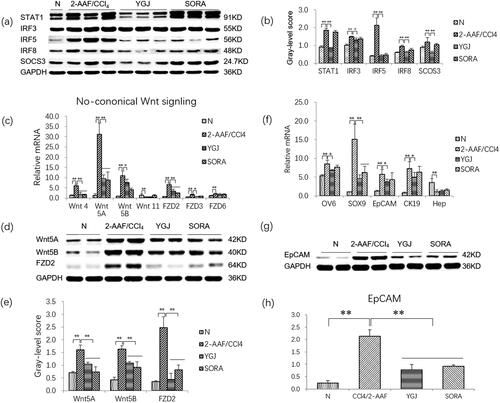
Figure 4. YGJ inhibits the differentiation of WB-F344 cells into myofibroblasts through inhibiting the activation of M1 macrophages. (a) α-SMA immunofluorescent staining (green) in WB-F344 cells (×200) (the presented in vitro experiments were conducted in the same batch, the normal and model groups used the same pictures as published articles. The figures of WB-F344 co-cultured with inactivated macrophages and WB-F344 co-cultured with M1 macrophages were reused form a previous study [Ying Xu et al. Citation2018] and are reproduced with permission here). (b) α-SMA mRNA expression in WB-F344 cells was measured by RT-PCR and normalized to GAPDH mRNA (n = 3 per group). (c) STAT1, NF-κB, IRF3, IRF5, IRF8, and SOCS3 mRNA expressions in RAW264.7 cells were measured by RT-PCR and normalized to GAPDH mRNA (n = 3 per group); (d) STAT1, NF-κB, IRF3, IRF5, and SOCS3 protein bands were depicted in the immunoblot images, and (e) the densitometric quantification of the protein bands presented as a histogram (n = 3 per group). *p < 0.05 and **p < 0.01. N: WB-F344 cells co-cultured with inactivated RAW264.7 cells; M: WB-F344 cells co-cultured with LPS (100 ng/mL)-activated RAW264.7 cells (referred to as LPS-RAW264.7); YGJ: WB-F344 cells co-cultured with LPS-RAW264.7 treated with Yiguanjian decoction; WIF-1: WB-F344 cells co-cultured with LPS-RAW264.7 treated with Wnt inhibitory factor-1.
![Figure 4. YGJ inhibits the differentiation of WB-F344 cells into myofibroblasts through inhibiting the activation of M1 macrophages. (a) α-SMA immunofluorescent staining (green) in WB-F344 cells (×200) (the presented in vitro experiments were conducted in the same batch, the normal and model groups used the same pictures as published articles. The figures of WB-F344 co-cultured with inactivated macrophages and WB-F344 co-cultured with M1 macrophages were reused form a previous study [Ying Xu et al. Citation2018] and are reproduced with permission here). (b) α-SMA mRNA expression in WB-F344 cells was measured by RT-PCR and normalized to GAPDH mRNA (n = 3 per group). (c) STAT1, NF-κB, IRF3, IRF5, IRF8, and SOCS3 mRNA expressions in RAW264.7 cells were measured by RT-PCR and normalized to GAPDH mRNA (n = 3 per group); (d) STAT1, NF-κB, IRF3, IRF5, and SOCS3 protein bands were depicted in the immunoblot images, and (e) the densitometric quantification of the protein bands presented as a histogram (n = 3 per group). *p < 0.05 and **p < 0.01. N: WB-F344 cells co-cultured with inactivated RAW264.7 cells; M: WB-F344 cells co-cultured with LPS (100 ng/mL)-activated RAW264.7 cells (referred to as LPS-RAW264.7); YGJ: WB-F344 cells co-cultured with LPS-RAW264.7 treated with Yiguanjian decoction; WIF-1: WB-F344 cells co-cultured with LPS-RAW264.7 treated with Wnt inhibitory factor-1.](/cms/asset/659f6d01-4c5c-4ad4-a1d6-b2b809032b00/iphb_a_1961820_f0004_c.jpg)
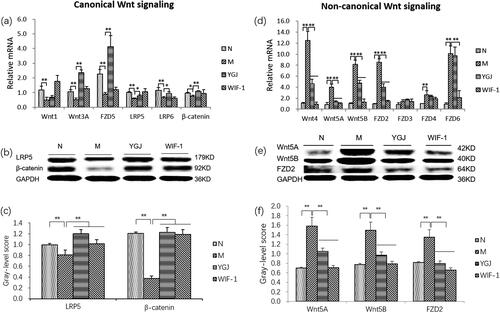
Figure 5. YGJ inhibits the differentiation of WB-F344 cells into myofibroblasts is related to the regulation of Wnt signalling activation. (a) Wnt-1, -3 A, FZD5, LRP-5, -6, and β-Catenin mRNA expressions in WB-F344 cells were measured by RT-PCR and normalized to GAPDH mRNA (n = 3 per group); (b) LRP-5 and β-Catenin protein bands were depicted in the immunoblot images, and (c) the densitometric quantification of the protein bands presented as a histogram (n = 3 per group). (d) Wnt-4, -5 A, -5B, FZD-2, -3, -4, and -6 mRNA expressions in WB-F344 cells were measured by RT-PCR and normalized to GAPDH mRNA (n = 3 per group); (e) Wnt -5 A, -5B, and FZD-2 protein bands were depicted in the immunoblot images, and (f) the densitometric quantification of the protein bands presented as a histogram (n = 3 per group). *p < 0.05 and **p < 0.01. N: WB-F344 cells co-cultured with inactivated RAW264.7 cells; M: WB-F344 cells co-cultured with LPS (100 ng/mL)-activated RAW264.7 cells (referred to as LPS-RAW264.7); YGJ: WB-F344 cells co-cultured with LPS-RAW264.7 treated with Yiguanjian decoction; WIF-1: WB-F344 cells co-cultured with LPS-RAW264.7 treated with Wnt inhibitory factor-1.