Figures & data
Figure 1. Effects of LBSO on anti-ageing in the testis in vivo. (A) Haematoxylin and eosin (H&E)-stained testicular tissues, 400× magnification. The expression of β-galactosidase located in the testicular tissue was observed by immunohistochemical staining (magnification 400×). (B) Analysis of the density mean of β-galactosidase. The data of the positive staining-integral optical density/area (IOD/area, density mean) were expressed as the mean ± SD, n = 10; *p < 0.05, compared to the control group. (C) The expression of p16INK4A, p21Waf1/Cip1, p-γH2AX, and β-galactosidase in the testicular tissue was detected by Western blot. The relative expression of (D) p16INK4A, (E) p21Waf1/Cip1, (F) p-γH2AX, and (G) β-galactosidase in testicular tissue. Densitometry was used to compare the expression levels. β-Actin was used as an internal loading control. All data were expressed as the mean ± SD, n = 10; *p < 0.05, **p < 0.01, ***p < 0.001, compared to the ageing model.
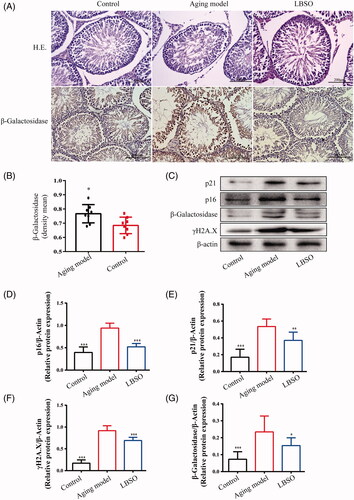
Figure 2. Effects of LBSO on antioxidative stress in the testis in vivo. (A) Representative Western blot image; mean densities of (B) HO-1, (C) NRF2, (D) SOD-1, and (E) SOD-2 in testicular tissue. Densitometry was used to compare the expression levels. β-Actin was used as an internal loading control. All data were expressed as the mean ± SD, n = 10; *p < 0.05, ***p < 0.001, compared with the ageing model. (F) The levels of SOD, 8-OHdG, ROS, MDA, and GSH in serum were measured. All data were expressed as the mean ± SD, n = 10; *p < 0.05, compared to the ageing model.
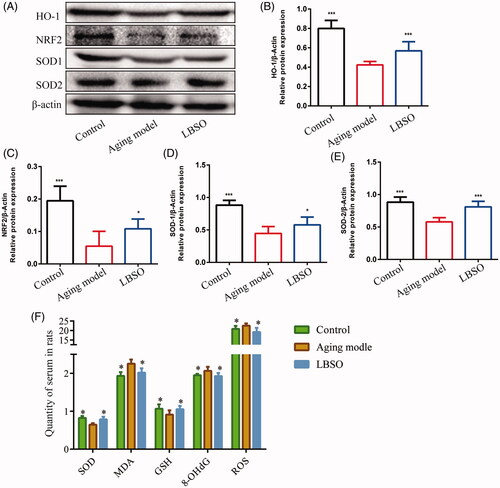
Figure 3. Function of testis was improved by LBSO. (A) Histomorphological changes in the testicular tissue of rats with LBSO. (B) Grades of testicular tissues depend on the Johnsen score. (C) Endocrine testosterone was detected in the rat serum. (D) Secretory cytokine level of INHB was measured in the rat serum.
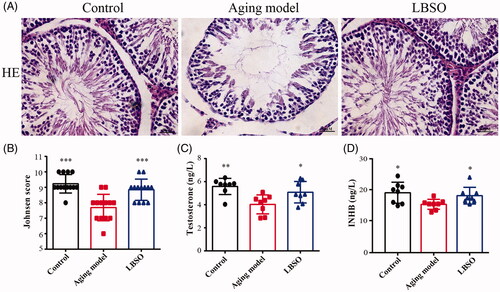
Figure 4. Expression SIRT3 in Sertoli cells in testicular tissue. (A) The location of Sertoli cells was labelled by specific marker WT1, and SIRT3 was localised in testicular tissue by IF. (B) Representative Western blot image of SIRT3. (C) The relative expression of SIRT3 in testicular tissue. Densitometry was used to compare the expression levels. β-Actin was used as an internal loading control. All data were expressed as the mean ± SD, n = 10; **p < 0.01, ***p < 0.001, compared to the ageing model.
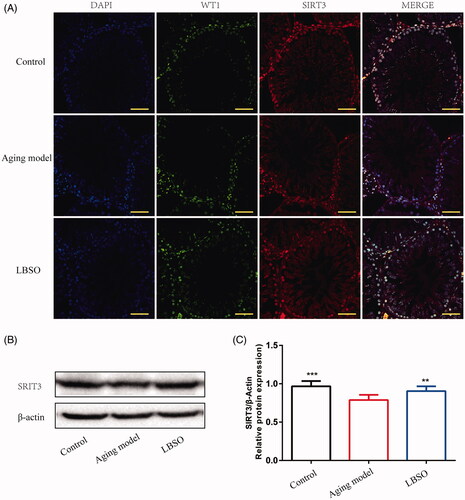
Figure 5. Optimal concentration of LBSO was screened in vitro. (A) TM4 cells were stained with β-galactosidase in the intervention of different concentrations of LBSO (magnification 100×), and the positive rate of cells in blue due to β-galactosidase. (B) The cell viability showed the ED50 of LBSO. (C) The number of TM cells was measured by CCK-8 in various concentrations of LBSO. (D) Representative Western blot image of SIRT3, HO-1, SOD-1, and SOD-2. (E–H) The relative expression of SIRT3, HO-1, SOD-1, and SOD-2 in testicular tissue. Densitometry was used to compare the expression levels. β-Actin was used as an internal loading control. All data were expressed as the mean ± SD, n = 10; *p < 0.05, ***p < 0.001, compared to the ageing model.
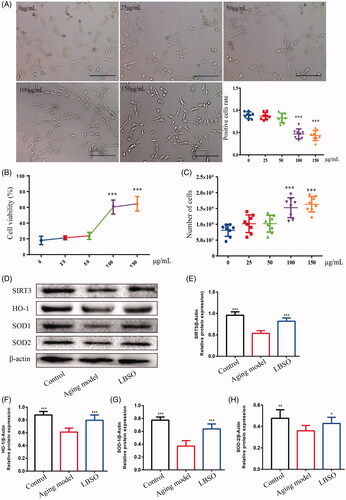
Figure 6. TM4 cells were infected by lentivirus with silencing SIRT3. (A) The transfection rate of cells was observed under a fluorescence microscope (magnification 200×). (B) The location of SIRT3 was expressed in TM4 cells by IF (magnification 400×). (C) The expression of SIRT3 in TM4 cells by Western blot. Densitometry was used to compare the expression levels. β-Actin was used as an internal loading control. Data were expressed as the mean ± SD, n = 8; ***p < 0.001, compared to the control siRNA group.
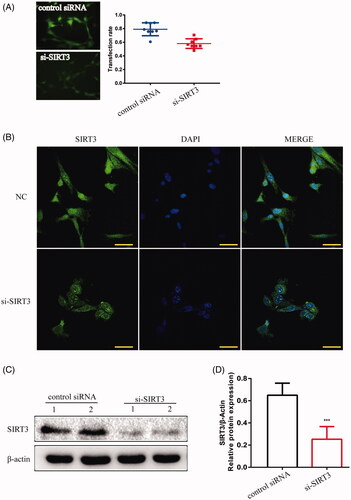
Figure 7. TM4 cells were transfected with SIRT3-overexpression- lentivirus. (A) The transfection rate of cells was observed under a fluorescence microscope (magnification 200×). (B) The location of SIRT3 in TM4 cells by IF (magnification 400×). (C) The expression of SIRT3 in TM4 cells by Western blot. Densitometry was used to compare expression levels. β-Actin was used as an internal loading control. All data were expressed as the mean ± SD, n = 8; *p < 0.05, compared to the control group.
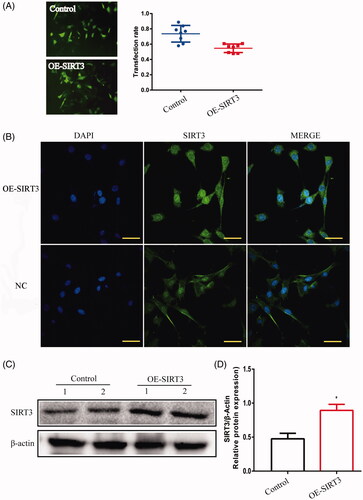
Figure 8. The effects of LBSO on anti-oxidation in SIRT3. (A) Representative Western blot image; mean densities of (B) SIRT3, (C) HO-1, (D) SOD-1, and (E) SOD-2 of TM4 cells in control, LBSO, si-SIRT3, and si-SIRT3-LBSO group. Densitometry was used to compare the expression levels. β-Actin was used as an internal loading control. All data are expressed as the mean ± SD, n = 10; *p < 0.05, **p < 0.01, ***p < 0.001, compared to the control group; ##p < 0.01, ###p < 0.001, compared to the LBSP group.
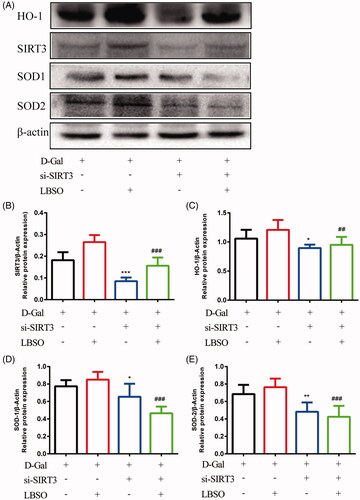
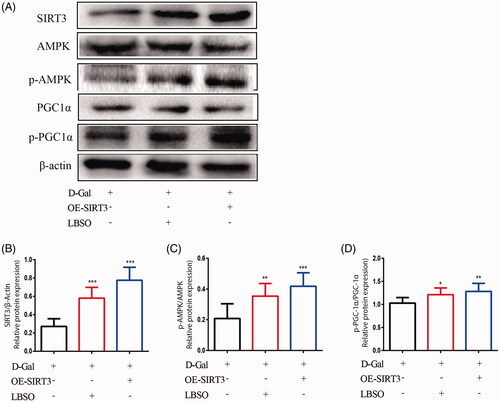
Figure 9. The effects of LBSO on anti-oxidation via SIRT3/AMPK/PGC-1α. (A) Representative Western blot image; mean densities of (B) SIRT3, (C) AMPK, (D) SOD-1, and (E) PGC-1α of TM4 cells in the control group, OE-SIRT3 group, and LBSO group. Densitometry was used to compare the expression levels. The data are expressed as the mean ± SD, n = 10; *p < 0.05, **p < 0.01, ***p < 0.001, compared to the control group.