
Figures & data
Figure 1. Kaempferol reduced atherosclerotic lesion size and lesion lipid deposition in mice. Atherosclerotic lesion formation detected by red oil O staining (A); the quantitative data of Oil Red staining (B); Atherosclerotic lesion formation detected by HE staining (C) (n = 5).
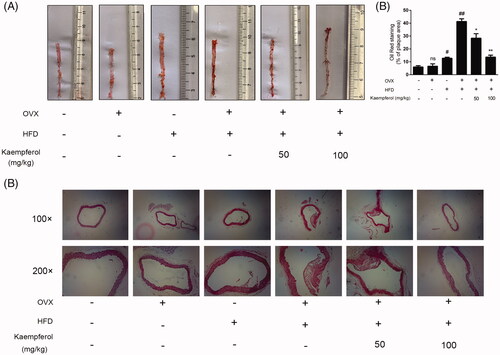
Figure 2. Kaempferol regulated lipid accumulation in mice. (A–D) Changes in the levels of serum LDL-C, HDL-C, T-CHO and TG in different groups. The results were analysed with one-way ANOVA and unpaired t-test and showed as the mean ± SD. #p < 0.05, ##p < 0.01, and ###p < 0.001 vs. the control group; *p < 0.05, and **p < 0.01 vs. the OVX-HFD group (n = 5).
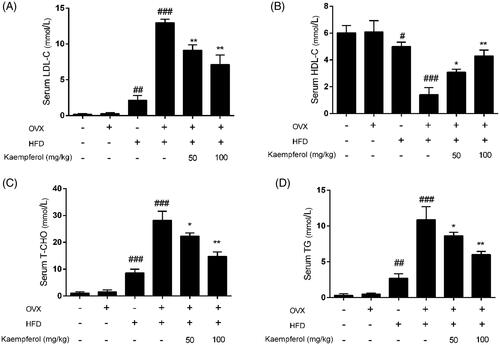
Figure 3. Kaempferol mitigated the oxidative stress and inflammation in vivo. (A–E) Changes in the levels of serum SOD, MDA, GSH, TNF-α and IL-6 in different groups. (F–H) Changes in the arterial tissue protein expression of ICAM-1 and VCAM-A in different groups. The results were analysed with one-way ANOVA and unpaired t-test and showed as the mean ± SD. #p < 0.05, ##p < 0.01, and ###p < 0.001 vs. the control group; *p < 0.05, and **p < 0.01 vs. the OVX-HFD group; ns: not significant (p > 0.05 vs. the control group) (n = 5).
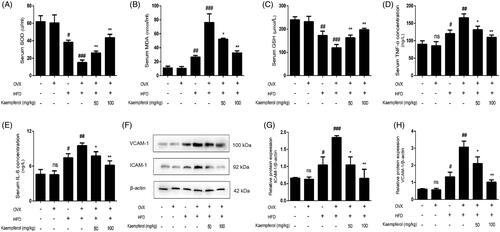
Figure 4. Kaempferol inhibited the apoptosis in vivo. Changes of Bax/Bcl-2 ratio (A) and caspase 3 expression (B) in arterial tissue. Data were analysed with one-way ANOVA and unpaired t-test and presented as the mean ± SD. #p < 0.05, and ##p < 0.01 vs. the control group; *p < 0.05, and **p < 0.01 vs. the OVX-HFD group; ns: not significant (p > 0.05 vs. the control group) (n = 5).
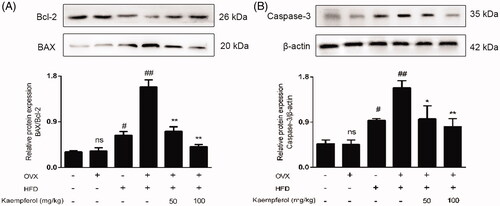
Figure 5. Kaempferol upregulated GPER and then activated PI3K/AKT/Nrf2 pathway. Changes in expression level of GPER (A), PI3K (C), Nrf-2 (E), HO-1 (F) and P-AKT/AKT ratio (D) in arterial tissue. All date was analysed with one-way ANOVA and unpaired t-test and showed as the mean ± SD. #p < 0.05, and ##p < 0.01 vs. the control group; *p < 0.05, and **p < 0.01 vs. the OVX-HFD group; ns: not significant (p > 0.05 vs. the control group) (n = 5).
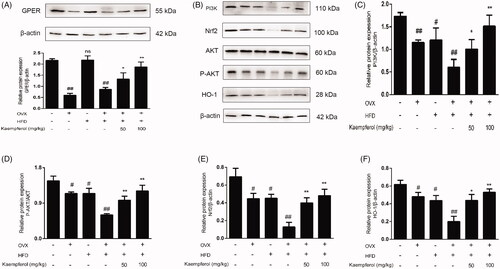
Figure 6. Cell viability after the treatment of various of concentrations of ox-LDL and kaempferol. The effect of ox-LDL (A) kaempferol (B) and combination ox-LDL with kaempferol (C) on cell viability in HASCs cells. All results were analysed with one-way ANOVA and unpaired t-test and showed as the mean ± SD. ##p < 0.01 and ###p < 0.01 vs. the control group; *p < 0.05, **p < 0.01 and ***p < 0.001 vs. the ox-LDL group; ns: not significant (p > 0.05 vs. the control group) (n = 5).
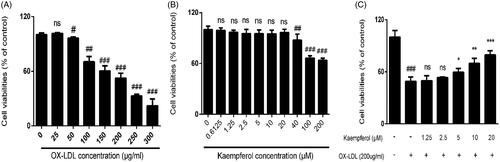
Figure 7. Kaempferol inhibited the ox-LDL induced apoptosis in HAEC cells. TUNEL staining results in different groups (A, B). The changes in the expression of caspase 3 and Bax/Bcl-2 ratio in HAEC cells (C–E). Data were analysed by one-way ANOVA and unpaired t-test and presented as the mean ± SD. ##p < 0.01 and ###p < 0.001 vs. the control group; *p < 0.05, and **p < 0.01 vs. the ox-LDL group; ns: not significant (p > 0.05 vs. the control group) (n = 5).
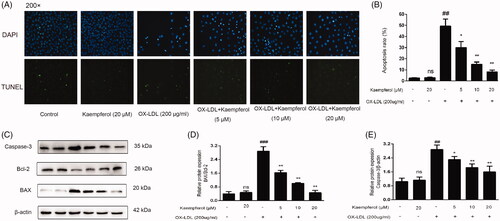
Figure 8. Kaempferol inhibited the ROS accumulation and reduced the level of inflammation factors. HAECs cells were treated with kaempferol or free-foetal medium. Then, the cells were treated with indicated drugs or complete medium. The changes in ROS accumulation (A), the expression of ICAM-1 (C) and VCAM-1 (D) and level of TNF-α (E) and IL-6 (F) in HAEC cells were shown. Data are analysed by one-way ANOVA and unpaired t-test and presented as the mean ± SD. ##p < 0.01 and ###p < 0.001 vs. the control group. *p < 0.05 and **p < 0.01 and ***p < 0.01 vs. the ox-LDL group. ns: not significant (p > 0.05 vs. the control group) (n = 5).
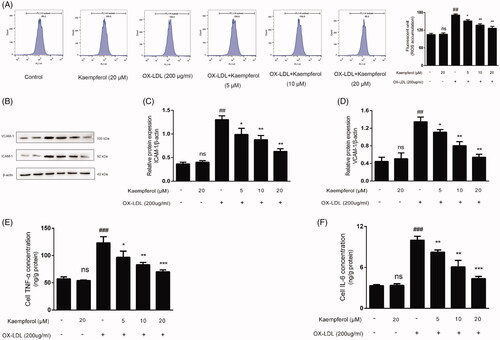
Figure 9. Kaempferol activated the GPER and regulated the PI3K/AKT/Nrf2 Pathway. HAECs cells were treated with kaempferol or free-foetal medium. Then, the cells were treated with indicated drugs or complete medium. The expression of GPER (A), PI3K (C), P-AKT/AKT (D), Nrf2 (E) and HO-1 (F) was detected by Western blot assay. Data are analysed by one-way ANOVA and unpaired t-test and presented as the mean ± SD. ##p < 0.01 vs. the control group. *p < 0.05 and **p < 0.01 vs. the ox-LDL group. ns: not significant (p > 0.05 vs. the control group) (n = 5).
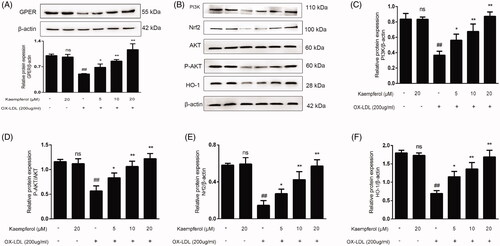
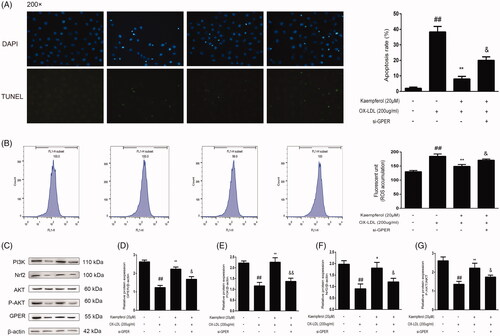
Figure 10. GPER is involved in the effect of kaempferol on apoptosis, ROS and PI3K/AKT/Nrf2 pathway. HAECs cells were treated with kaempferol or kaempferol and si-GPER or free-foetal medium. Then, the cells were treated with indicated drugs or complete medium. The changes in apoptosis (A), ROS accumulation (B), GPER and PI3K/AKT/Nrf2 pathway (C–G) are shown. Data are analysed by one-way ANOVA and unpaired t-test and presented as the mean ± SD. ##p < 0.01 vs. the control group. *p < 0.05 and **p < 0.01 vs. the ox-LDL group. &p < 0.05 and &&p < 0.01 vs. the kaempferol + ox-LDL group (n = 5).
Data availability statement
The data used to support the findings of this study are available from the corresponding author upon request.