Figures & data
Figure 1. Effect of SPJ on cognitive impairment in ageing rats. (A) Escape latency (B) path length and (C) swim speed of SD rats during learning session. (D) Comparison of numbers of crossing over platform site on day 6. (E) Comparison of time spent in target quadrant on day 6. (F) Representative route on day 6. **p < 0.01 vs. 5 M group; #p < 0.05 vs. 22 M group.
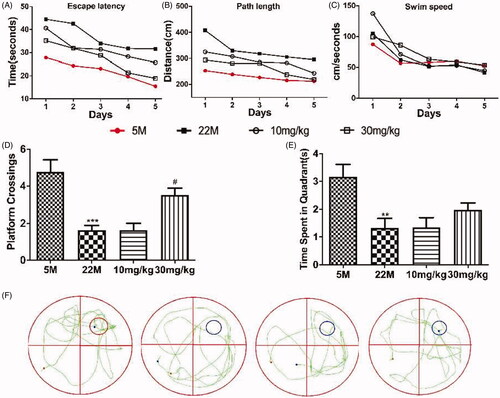
Figure 2. Effect of SPJ on the morphology of microglia and synapses in ageing rats through transmission electron microscope. The morphology of microglial nucleus (A), cytoplasm (B) and neuronal synapses (C) demonstrated that treatment with SPJ at 10 and 30 mg/kg exerted neuroprotective effect by improving damaged microglia and synapses in cortex. Yellow arrows indicate chromatin; Red arrows indicate mitochondria; Orange arrows indicate synapses.
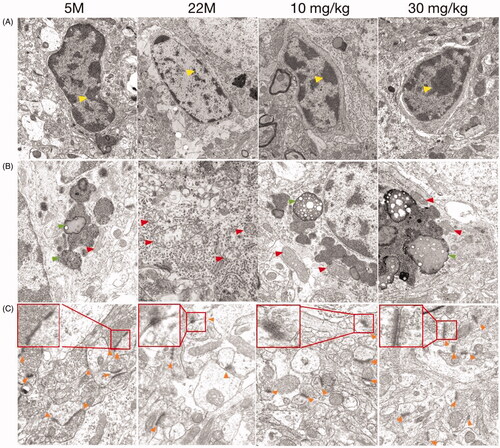
Figure 3. Effect of SPJ on CD206 and YM-1 protein levels in the hippocampus of ageing rats. (A) Representative immunoblot bands of CD206 and YM-1 in hippocampus. (B) and (C) Quantification of CD206/β-actin ratio and YM-1/β-actin ratio. **p < 0.01 vs. 5 M group; #p < 0.05 vs. 22 M group.
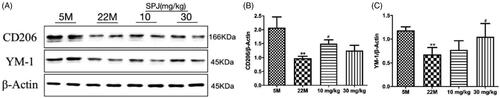
Figure 4. Effect of SPJ on autophagy-related protein levels in the hippocampus of ageing rats. (A) Representative immunoblot bands of LC3, Beclin1, ATG5 and p62 levels in hippocampus. (B–E) Quantification of LC3, Beclin1, ATG5 and p62 after normalisation to β-actin. #p < 0.05 vs. 5 M group; *p < 0.05 or **p < 0.01 vs. 22 M group.
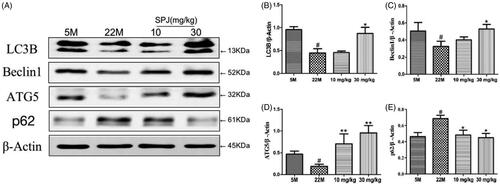
Figure 5. Effect of SPJ on microglial polarisation in LPS-induced BV2 cells. (A) Representative immunoblot bands of IL-1β and YM-1 in cells after stimulation by LPS. (B–C) Quantification of IL-1β and YM-1 after normalisation to β-actin (D) MTT showed that treatment with SPJ alone below the concentration of 200 μM did not induce toxicity in BV2 cells. (E) Representative immunoblot bands of IL-1β and YM-1 in cells upon a SPJ protection for 12 h followed by LPS stimulation. (F–G) Quantification of YM-1and IL-1β after normalisation to β-actin. (H) Confocal images show that the protein levels of TNF-α, IL-1β, ARG1 and TGFβ in BV2 after administrating SPJ in LPS groups. *p < 0.05, **p < 0.01 vs. control group; ##p < 0.01 vs. LPS group.
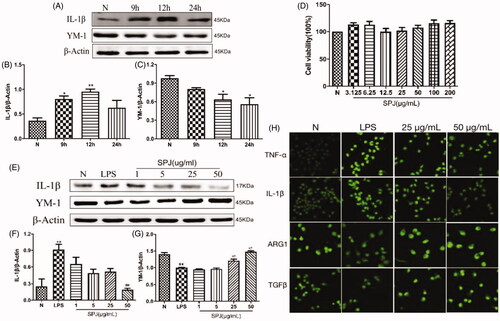
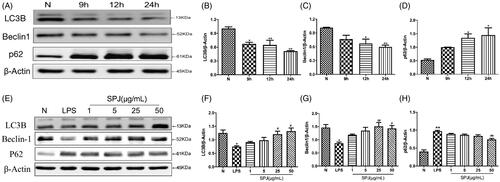
Figure 6. Effect of SPJ on microglial autophagy in LPS-induced BV2 cells. (A) Representative immunoblot bands of LC3B, Beclin1 and p62 in cells after stimulation by LPS. (E) Representative immunoblot bands of LC3B, Beclin1 and p62 in cells upon a SPJ protection for 12 h followed by LPS stimulation. (B–D, F–H) Quantification of LC3B, Beclin1 and p62 after normalisation to β-actin. *p < 0.05, **p < 0.01 vs. control group; #p < 0.05, ##p < 0.01 vs. LPS group.