Figures & data
Figure 1. Myristicin suppresses HCC proliferation in a dose-dependent manner. (A) The chemical formula of myristicin. (B, C) MTT analysis revealing cell viability when Huh-7 cells and HCCLM3 cells were treated with 0.5, 1 and 5 mM myristicin for 24 h, 48 h and 72 h. *,**p < 0.05, 0.01 vs. 0 mM myristicin treatment group.
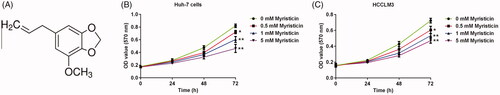
Figure 2. Myristicin induces cell apoptosis in Huh-7 cells in a dose-dependent manner. (A) FCM assay. (B) Cell apoptosis ratio analysed by a GraphPad Prism 6.0 software (La Jolla, CA). (C) Caspase3 activity was measured by the caspase3 detection kit. (D) Bcl-2 and Bax protein expression analysis by Western blot. (E, F) Bcl-2 and Bax mRNA expression analysis by qRT-PCR. *,**p < 0.05, 0.01 vs. 0 mM myristicin treatment group.
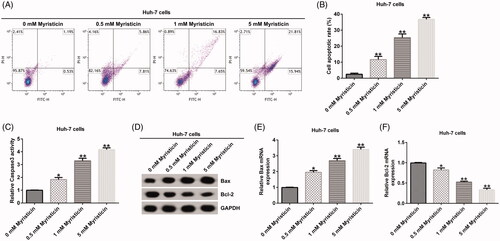
Figure 3. Myristicin induces cell apoptosis in HCCLM3 cells. (A) FCM assay. (B) Cell apoptosis ratio analysed by a GraphPad Prism 6.0 software (La Jolla, CA). (C) Caspase-3 activity was measured by the caspase-3 detection kit. (D) Bcl-2 and Bax protein expression analysis by Western blot. (E, F) Bcl-2 and Bax mRNA expression analysis by qRT-PCR. *,**p < 0.05, 0.01 vs. 0 mM myristicin treatment group.
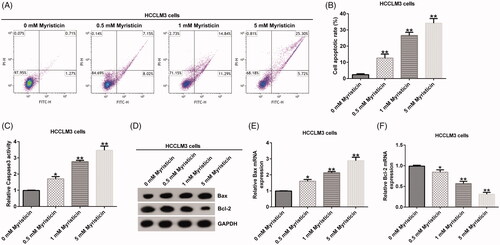
Figure 4. Myristicin suppressed migration and invasion of Huh-7 cells. (A) Transwell analysis of cell migration without matrigel in the lower chamber. (B) The number of migratory cells expressed as mean ± S.D. (C) Transwell analysis of cell invasion with matrigel in the lower chamber. (D) The number of invasive cells expressed as mean ± S.D. *,**p < 0.05, 0.01 vs. 0 mM myristicin treatment group.
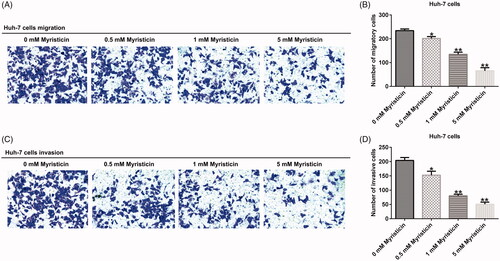
Figure 5. Myristicin suppressed migration and invasion of HCCLM3 cells. (A) Transwell analysis of HCCLM3 cell migration. (B) The number of migratory cells. (C) Transwell analysis of HCCLM3 cell invasion. (D) The number of invasive cells. *,**p < 0.05, 0.01 vs. 0 mM myristicin treatment group.
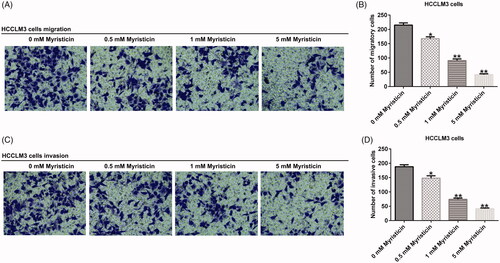
Figure 6. Myristicin inhibits EMT in Huh-7 cells. Huh-7 cells were treated with 0.5, 1 and 5 mM myristicin for 48 h. (A) Western blot analysis of E-cadherin and N-cadherin expression. (B) qRT-PCR analysis of E-cadherin expression. (C) qRT-PCR analysis of N-cadherin expression. *,**p < 0.05, 0.01 vs. 0 mM myristicin treatment group.
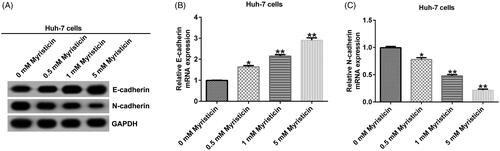
Figure 7. Myristicin inhibits EMT in HCCLM3 cells. (A) Western blot analysis of E-cadherin and N-cadherin expression. (B) qRT-PCR analysis of E-cadherin expression. (C) qRT-PCR analysis of N-cadherin expression. *,**p < 0.05, 0.01 vs. 0 mM myristicin treatment group.
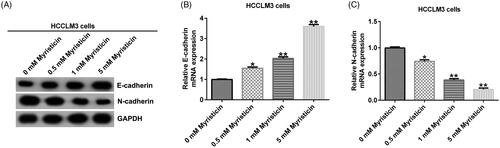
Figure 8. Myristicin suppresses the PI3K/Akt/mTOR signalling pathway in Huh-7 cells. (A) Western blot analysis of p-mTOR and p-AKT expression in Huh-7 cells. (B) The ratio of p-mTOR/mTOR in Huh-7 cells. (C) The ratio of p-AKT/AKT in Huh-7 cells. *,**p < 0.05, 0.01 vs. 0 mM myristicin treatment group.
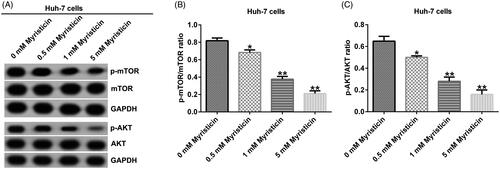
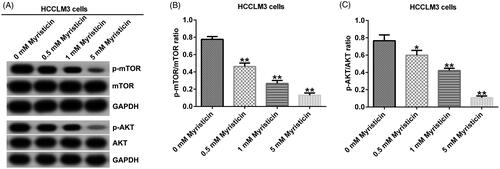
Figure 9. Myristicin suppresses the PI3K/Akt/mTOR signalling pathway in HCCLM3 cells. (A) Western blot analysis of p-mTOR and p-AKT expression in HCCLM3 cells. (B) The ratio of p-mTOR/mTOR in HCCLM3 cells. (C) The ratio of p-AKT/AKT in HCCLM3 cells. *,**p < 0.05, 0.01 vs. 0 mM myristicin treatment group.