Figures & data
Scheme 1. The schematic graph showing the bioadhesive hydrogel containing BR/β-CD inclusion complexes used to promote diabetic wound healing.
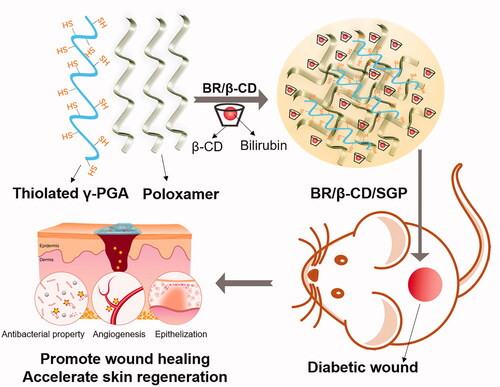
Figure 1. Characterization of BR/β-CD (A) FTIR spectra, (B) UV spectra, (C) XRD, (D) TGA, and (E) DSC of BR, β-CD, BR/β-CD, and BR + β-CD (the mixture of BR and β-CD). (F) Bilirubin content of BR and BR/β-CD after standing for 7 days. The recorded appearance images of (G) BR and (H) corresponding UV spectra in 7 days. The recorded appearance images of (I) BR/β-CD and (J) corresponding UV spectra in 7 days. **p < 0.05 compared to the BR solution group.
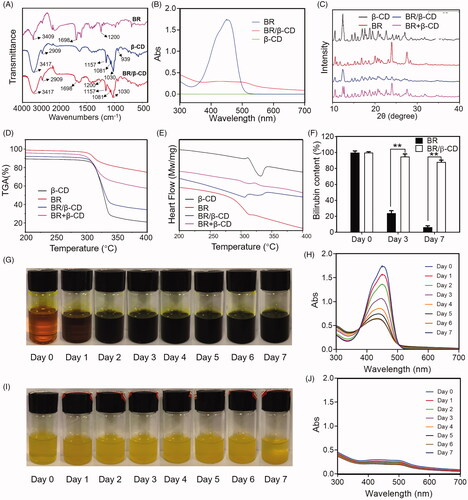
Figure 2. Characterization of BR/β-CD/SGP hydrogel. (A) The appearance of BR/β-CD solution, SGP, and BR/β-CD/SGP. (B) SEM images showed a cross-sectional morphology of SGP and BR/β-CD/SGP. (C) In vitro enzyme degradation rate of BR/β-CD/SGP. (D) Rheological behaviour of BR/β-CD/SGP. (E) Adhesive stress of different hydrogels. In vitro release profile of BR, BR/β-CD, and BR/β-CD/SGP in the (F) absence or (G) presence of H2O2. (H) Biocompatibility of BR/β-CD/SGP hydrogel. **p < 0.05 compared to control group; &&p < 0.05 compared to BR solution group. Each group was paralleled three times.
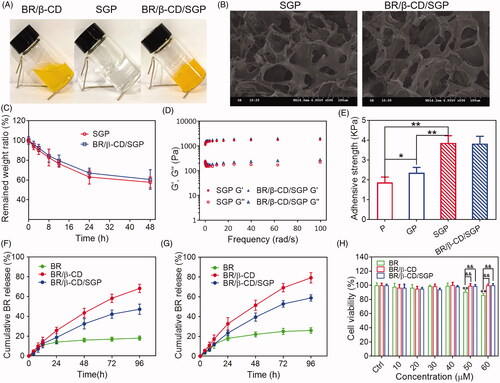
Figure 3. Cell migration and proliferation of HUVEC cells with treatments of BR, BR/β-CD, BR/β-CD/SGP hydrogel. (A) The images of HUVEC cell migration were recorded at 0 h (above) and 24 h (below) after scraping. Magnification: 100×. (B) The calculated wound closure rate. (C) The effect of BR, BR/β-CD, BR/β-CD/SGP on HUVEC proliferation was investigated using MTT assay. Data are shown as mean ± SD (n = 3). **p < 0.05 compared to control group; &&p < 0.05 compared to the BR solution group.
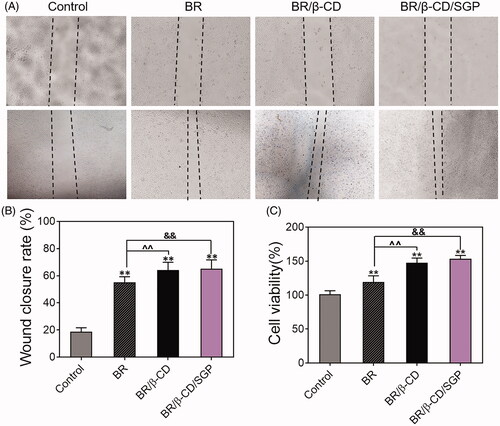
Figure 4. BR/β-CD/SGP hydrogel accelerated wound closure. (A) Representative images of wound healing process treated with BR or BR/β-CD/SGP hydrogel on both normal (Nor) or diabetic rats (DM). (B) Wound closure of all five groups. (C) H&E staining images of full-thickness wounds on days 3 and 7; arrows indicate the centre of the wound, scale bar: 500 μm. Quantification of the wound length at (D) day 3 and (E) day 7. Data are shown as mean ± SD (n = 6). **p < 0.05 compared to DM control group; ^^p < 0.05 compared to normal control group; @@p < 0.05 compared with BR-treated DM group.
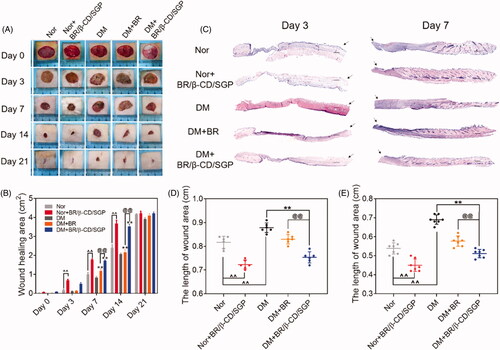
Figure 5. (A) Immunohistochemical analysis of CD86, MPO, and TNF-α at day 3 post wound injury. Scale bar: 100 μM. The corresponding quantitative analysis of (B) CD86, (C) MPO, and (D) TNF-α. Data are presented as mean ± SD (n = 3). ^^, p < 0.05 compared to normal wound group; **, p < 0.05 compared to diabetic wound group; @@, p < 0.05 compared to BR-treated diabetic wounds.
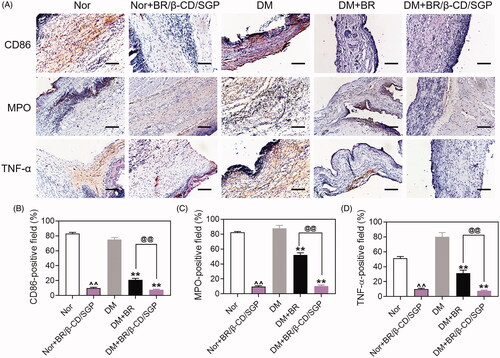
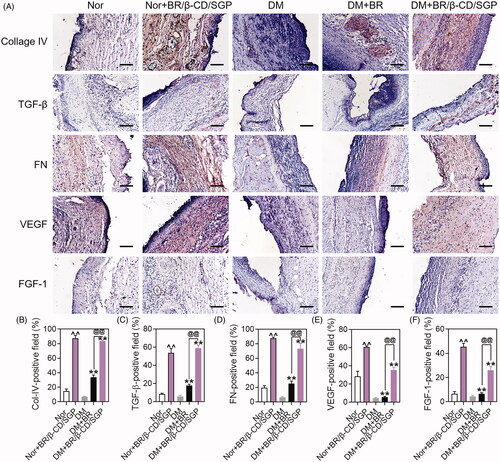
Figure 6. (A) Immunohistochemical analysis of Collage IV, TGF-β, FN, VEGF, FGF-1 at day 14 post wound injury. Scale bar: 100 μM. The corresponding quantitative analysis of (B) Collage IV, (C) TGF-β, (D) FN, (E) VEGF, and (F) FGF-1. Data are presented as mean ± SD (n = 3). ^^p < 0.05 compared to the normal wound group; **p < 0.05 compared to diabetic wound group; @@p < 0.05 compared to BR-treated diabetic wounds.