Figures & data
Table 1. MS parameters for ambrisentan, (S)-4-hydroxymethyl ambrisentan and midazolam.
Figure 1. UPLC–MS/MS chromatograms of ambrisentan, its metabolite (S)-4-hydroxymethyl ambrisentan and IS. (A) A blank serum sample; (B) a blank plasma sample spiked with ambrisentan, (S)-4-hydroxymethyl ambrisentan and IS; (C) a rat plasma sample.
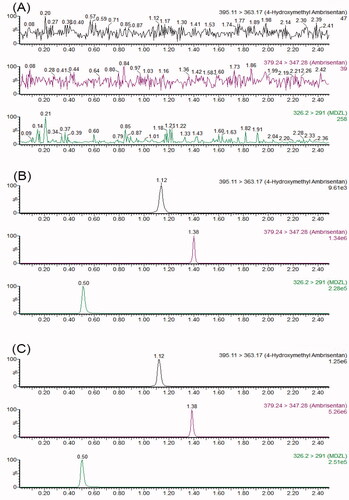
Table 2. Precision, accuracy, matrix effect (ME) and recovery for analytes of QC sample in rat plasma (n = 6).
Figure 2. Mean ± SD concentration–time curve of ambrisentan (A) and (S)-4-hydroxymethyl ambrisentan (B) in two groups (n = 6 each group).
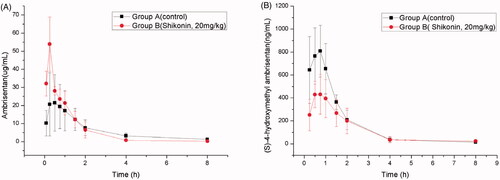
Table 3. The main pharmacokinetic parameters of ambrisentan in rat plasma in two groups (n = 6).
Table 4. The main pharmacokinetic parameters of (S)-4-hydroxymethyl ambrisentan in rat plasma in two groups (n = 6).
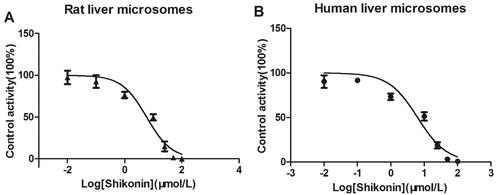
Figure 3. Various concentrations of shikonin for half-maximal inhibitory concentration (IC50) in the activity of (A) rat liver microsomes and (B) human liver microsomes. Values are mean ± SD, n = 3.