
Figures & data
Figure 1. Effects of oral 2036S-QXR on body weight during the 26-week period of administration and at the end of the 4-week recovery period. (A) Changes in body weight in female rats. (B) Changes in body weight in male rats. The number of female and male animals in each group (0–13 weeks) was 15. The number of female and male animals in each group (13–26 weeks) was 10. The number of female and male animals in each group at the end of the 4-week recovery period (30 weeks) was 3. There were no significant differences in the bodyweight of males and females in the treatment groups compared with the control group (p > 0.05). Mean ± SD.
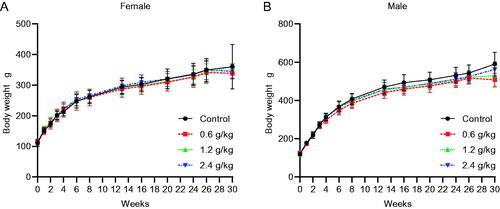
Table 1. Food intake (g/100g body weight/week) after the administration of 2036S-QXR.
Table 2. Urinary analysis after the administration of 2036S-QXR.
Figure 2. Hematological parameters of the rats after administration of 2036S-QXR for 13 and 26 weeks, and at the end of the recovery period. *p < 0.05 and **p < 0.01 as compared to the control group (0 g/kg). Mean ± SD. n = 5 for 13 weeks, n = 7 for 26 weeks, and n = 3 for the recovery period.
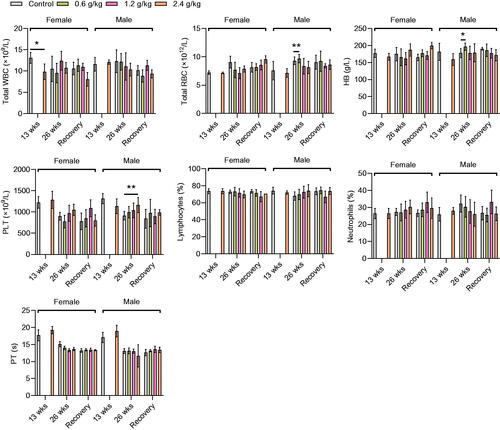
Table 3. Incidence of histopathological lesions in various organs after the administration of 2036S-QXR for 26 weeks and at the end of the recovery period.
Figure 3. Biochemical parameters of rats after administration of 2036S-QXR for 13 and 26 weeks, and at the end of the recovery period. *p < 0.05 and **p < 0.01 as compared to the control group (0 g/kg). Mean ± SD. n = 5 for 13 weeks, n = 7 for 26 weeks, and n = 3 for the recovery period.
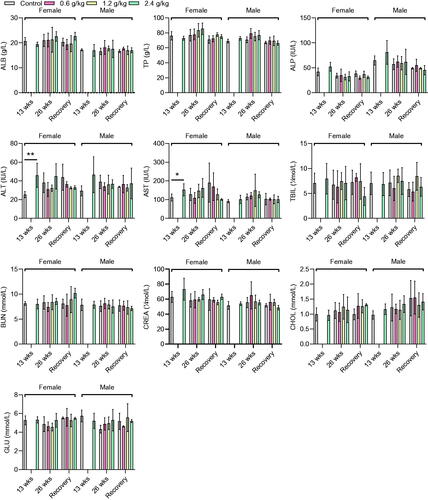
Figure 4. Effects of oral 2036S-QXR on the relative organ weight (g/100 g body weight). The p-values in all treatment groups were not significant compared with the control group. Mean ± SD. n = 5 for 13 weeks, n = 7 for 26 weeks, and n = 3 for the recovery period.
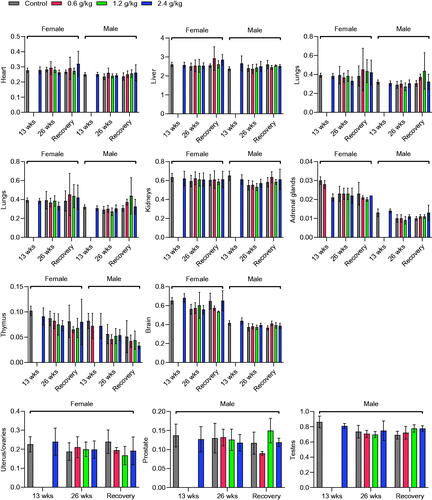
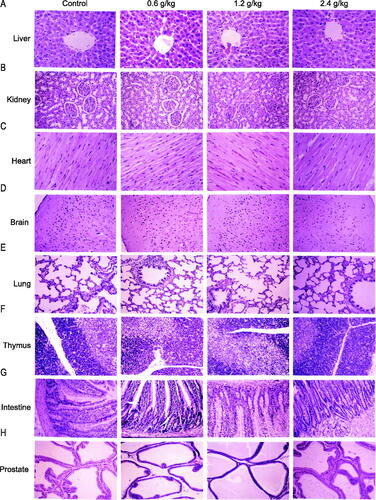
Figure 5. Histopathological organ examination after administration of 2036S-QXR using haematoxylin and eosin staining (10×). (A) Representative images of liver sections. (B) Representative images of kidney sections. (C) Representative images of heart sections. (D) Representative images of brain sections. (E) Representative images of lung sections. (F) Representative images of thymus sections. (G) Representative images of intestinal sections. (H) Representative images of prostate sections.
Data availability statement
The authors confirm that the data supporting the findings of this study are available within the article.