Figures & data
Figure 1. The UPLC-Q-TOF-MS/MS analysis carried out at both positive ion mode (A) and negative ion mode (B), and indicated 30 compounds in the M-BYF.
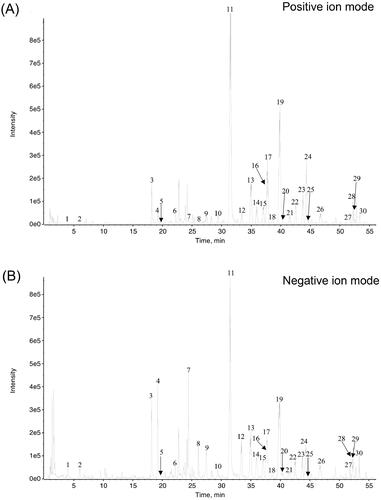
Table 1. Chemical profile of M-BYF.
Figure 2. HPLC chromatograms of M-BYF at 270 nm. Representative chromatograms of standard reference compounds (A) and M-BYF (B) were shown respectively. (1) Icariin, (2) calycosin-7-glucoside, (3) catalpol, (4) baicalin and (5) paeoniflorin.
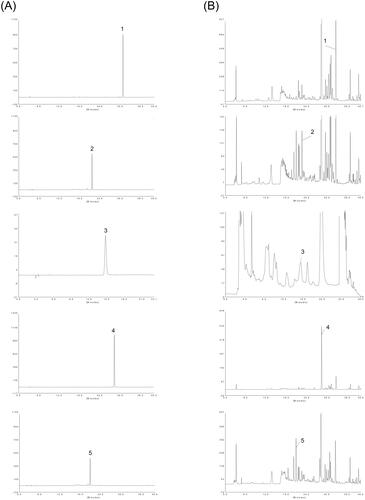
Table 2. qRT-PCR primer sequences.
Table 3. Contents of the five main compounds in three batches of M-BYF.
Figure 3. Changes in the body weight of mice treated with M-BYF for seven days. Time course of mean body weight after intragastric administration of M-BYF in female (A) and male (B) mice.
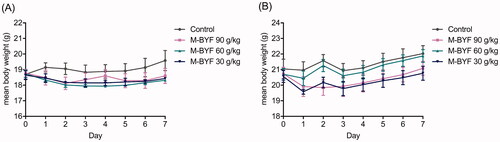
Figure 4. Experimental protocol of OVA sensitization and challenge in mice and effect of M-BYF on AHR. (A) Female BALB/c mice were sensitized and challenged with OVA in a 49-day asthma induction protocol. Starting on day 21, mice were treated with M-BYF or Dexamethasone by gavage every day during 28 days. Within 24 h of the last OVA challenge, anaesthetized mice were instrumented to measure AHR. (B) M-BYF markedly decreased RL in asthmatic mice as compared with the Model group. (C) M-BYF obviously improved Cdyn in asthmatic mice as compared with the Model group. Dexamethasone was used as positive drug. Data are represented as mean ± S.E.M. n = 8 in each group. (ΔΔΔp < 0.001 compared with the Control group; ***p < 0.001, **p < 0.01 compared with the Model group; ###p < 0.001, ##p < 0.01 and #p < 0.05 compared with the dexamethasone treated group.)
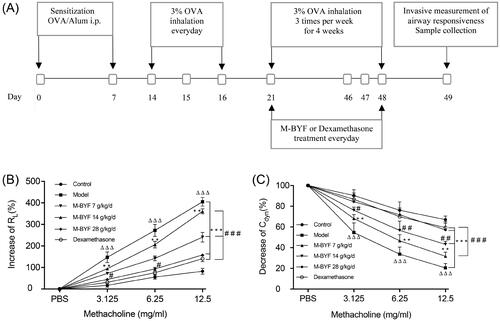
Figure 5. M-BYF alleviated airway inflammation, mucus hypersecretion and collagen deposition in OVA-induced asthmatic mice. (A) The infiltration of inflammatory cells into the lungs was measured by H&E staining. Scale bar: 50 µm. (D) The inflammatory changes were expressed as inflammation score. (B) Airway mucus secretion was detected by PAS staining. Scale bar: 50 µm. (E) Degree of mucus secretion was calculated by dividing PAS-stained positive area (μm2) in the bronchus (APAS+) by the perimeter (μm) of the basement membrane (Pbm). (C) Airway collagen deposition was evaluated by Masson’s trichrome staining. Scale bar: 50 µm. (F) The extent of collagen deposition was expressed as collagen score. Three non-consecutive sections from each animal were averaged and compared among experimental groups. n = 8 in each group. Data are represented as mean ± S.E.M. (ΔΔΔp < 0.001 compared with the Control group; ***p < 0.001, **p < 0.01 and *p < 0.05 compared with the Model group; ###p < 0.001, ##p < 0.01 and #p < 0.05 compared with the dexamethasone treated group.)
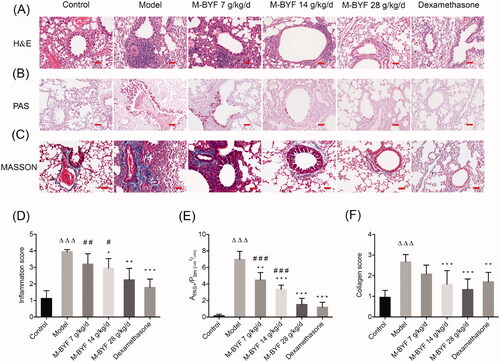
Figure 6. Effects of M-BYF on percentages of ILC2s and Th9 cells in lungs of OVA-induced asthmatic mice. (A) Gating strategy of ILC2s in the lungs of mice. Lineage (Lin) markers included CD3, CD19, CD4 and CD11b. The number indicates cell events. (B) Detection of ILC2s (CD45+Lin–ST2+CD90.2+CD127+) by flow cytometry. (C) M-BYF reduced percentage of ILC2s in lungs of asthmatic mice as compared with the Model group. (D) Gating strategy of Th9 cells in the lungs of mice. The number indicates cell events. (E) Detection of Th9 cells (CD45+CD4+IL9+) by flow cytometry. (F) M-BYF reduced percentage of Th9 cells in lungs of asthmatic mice as compared with the Model group; n = 8 in each group. Data are represented as mean ± S.E.M. (ΔΔΔp < 0.001 compared with the Control group; ***p < 0.001, **p < 0.01 compared with the Model group; ###p < 0.001, ##p < 0.01 and #p < 0.05 compared with the dexamethasone treated group.)
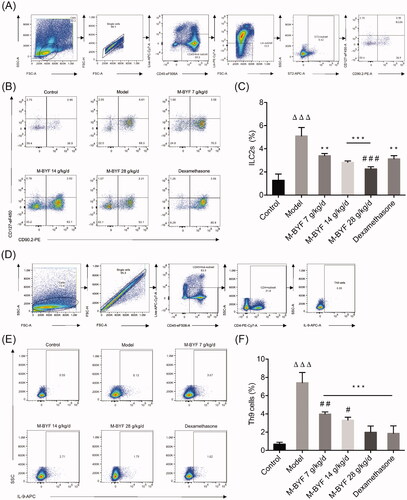
Figure 7. Effects of M-BYF on expression of IL-5, IL-13, IL-9, GATA3, PU.1 and IRF4 in OVA-induced asthmatic mice. M-BYF decreased levels of IL-5 (A), IL-13 (B) in BALF of asthmatic mice as compared with the Model group. M-BYF decreased gene expression of IL-9 (C), GATA3 (D), PU.1 (E) and IRF4 (F) in lungs of asthmatic mice as compared with the Model group; n = 6 in each group. Data are represented as mean ± S.E.M. (ΔΔp < 0.01 compared with the Control group; ***p < 0.001, **p < 0.01 and *p < 0.05 compared with the Model group; ###p < 0.001, ##p < 0.01 and #p < 0.05 compared with the dexamethasone treated group.)
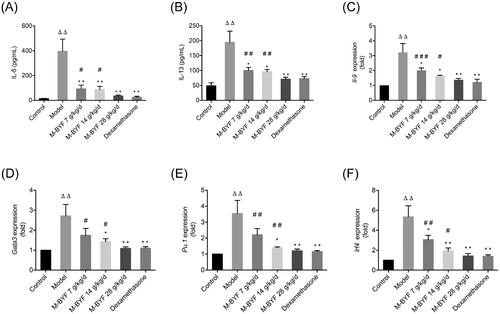
Figure 8. Effects of M-BYF on VIP expression and percentage of VIP+ cells in OVA-induced asthmatic mice. (A) VIP was down-regulated in the lungs of asthmatic mice with treatment of M-BYF by immunofluorescent staining. VIP staining as shown in red. Scale bar: 50 µm and 20 µm. (B) M-BYF decreased percentage of VIP+ cells in lungs of asthmatic mice as compared with the Model group. Four non-consecutive sections from each animal were averaged and compared among experimental groups; n = 3 in each group. M-BYF decreased gene expression of VIP (C) in lungs and level of VIP (D) in BALF of asthmatic mice as compared with the Model group; n = 6 in each group. Data are represented as mean ± S.E.M. (ΔΔΔp < 0.001, Δp < 0.05 compared with the Control group; ***p < 0.001, **p < 0.01 and *p < 0.05 compared with the Model group; ###p < 0.001, ##p < 0.01 and #p < 0.05 compared with the dexamethasone treated group.)
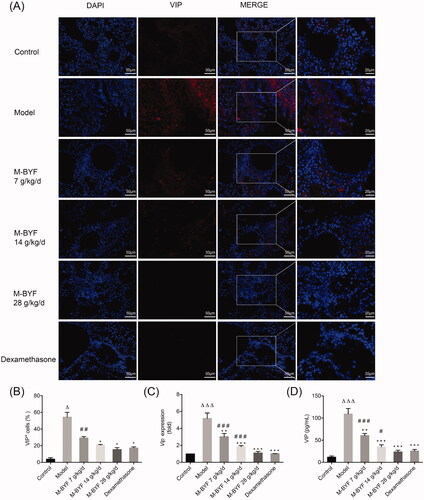
Figure 9. Effects of M-BYF on VPAC2 expression and VPAC2+CD90+ cells in OVA-induced asthmatic mice. (A) Representative immunofluorescent staining images of VPAC2 and VPAC2+CD90+ cells. VPAC2 staining as shown in red. CD90 staining as shown in green. Scale bar: 50 µm and 20 µm. (B, C) The protein expression of VPAC2 in lungs was detected by western blot and densitometric analysis was performed. M-BYF reduced the expression of VPAC2 protein in lungs of asthmatic mice as compared with the Model group (D) Quantification of VPAC2+CD90+ cells showed that M-BYF reduced percentage of VPAC2+CD90+ cells in lungs of asthmatic mice as compared with the Model group. Four non-consecutive sections from each animal were averaged and compared among experimental groups; n = 3 in each group. Data are represented as mean ± S.E.M. (ΔΔΔp < 0.001, Δp < 0.05 compared with the Control group; ***p < 0.001, **p < 0.01 and *p < 0.05 compared with the Model group; #p < 0.05 compared with the dexamethasone treated group.)
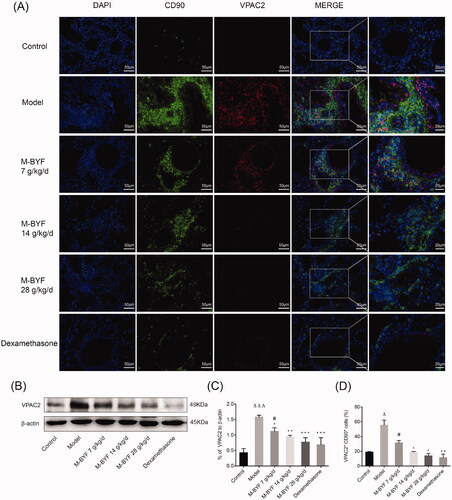
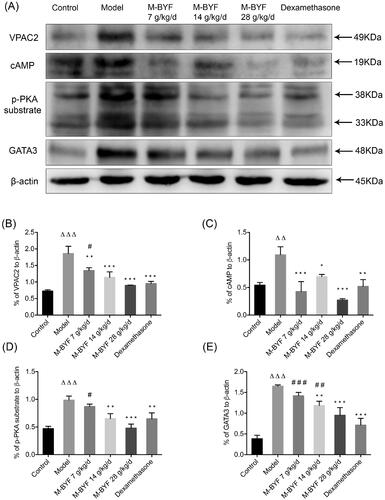
Figure 10. Effects of M-BYF on protein expression of VPAC2, cAMP, p-PKA substrate and GATA3 in lungs of OVA-induced asthmatic mice. (A) Western blot analysis of the protein expression of VPAC2, cAMP, p-PKA substrate and GATA3. (B–E) Quantification of relative levels of VPAC2, cAMP, p-PKA substrate and GATA3 showed that M-BYF reduced the expression of proteins associated with the VIP–VPAC2 signalling pathway in lungs of asthmatic mice as compared with the Model group; n = 3 in each group. Data are represented as mean ± S.E.M. (ΔΔΔp < 0.001, ΔΔp < 0.01 compared with the Control group; ***p < 0.001, **p < 0.01 and *p < 0.05 compared with the Model group; ###p < 0.001, ##p < 0.01 and #p < 0.05 compared with the dexamethasone treated group.)