
Figures & data
Figure 1. Aqueous extractions of YYJDD were qualitatively analysed by HPLC. The numbers in the chromatograms showed the constituent peaks. (A) Peak 1 was identified as 6-α-hydroxygeniposide. (B) Reference standard substance of 6-α-hydroxygeniposide. (C) Peak 2 was identified as hesperidin and peak 5 was sciadopitysin. (D) Reference standard substance of hesperidin. (E) Reference standard substance of sciadopitysin. (F) Peak 3 was identified as lobetyolin. (G) Reference standard substance of lobetyolin. (H) Peak 4 was identified as dioscin. (I) Reference standard substance of dioscin. A typical chromatogram was shown (n = 3).
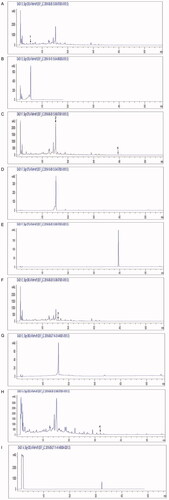
Table 1. Content of each identified ingredient in aqueous extract of YYJDD.
Figure 2. There was a moderate synergistic effect between gefitinib and YYJDD to inhibit the growth of H1975 cells. (A) H1975 cells were treated with different concentrations of gefitinib (2, 4, 8, 12, 16, 24, 32, 40 μM) for 24 h. Then, the cell viability was measured by MTT assay and IC50 of gefitinib was calculated. (B) H1975 cells were exposed to different concentrations of YYJDD (2, 4, 6, 8, 12, 16 mg/mL) for 24 h. Then, the cell survival rate was tested by MTT assay and IC50 of YYJDD was calculated. (C) H1975 cells were exposed to gefitinib, YYJDD, and combination treatment at the doses of 0.125, 0.25, 0.5, 1, 2, and 4 times IC50 values. Then, MTT assay was performed to evaluate the viability of cells. (D) Combined Index (CI) values at different levels of growth inhibition effect (fraction affected, FA) were calculated by Calcusyn software to analyse the synergism between gefitinib and YYJDD. (E) H1975 cells were exposed to gefitinib, YYJDD, and combination treatment for 24, 48, 72, and 96 h. MTT assay was applied to assess the cytotoxicity. Data were represented as mean ± SD. All experiments were done in triplicate. ***p < 0.001 compared with control, ▲p < 0.05, ▲▲p < 0.01 compared with gefitinib.
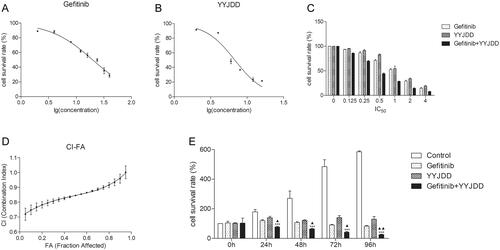
Table 2. Summary of CI values at 20, 50, and 80% FA.
Figure 3. YYJDD enhanced gefitinib-induced apoptosis in H1975 cells. H1975 cells were exposed to gefitinib, YYJDD and combination treatment for 24 h. (A, B) Cells were stained with Annexin V-FITC/PI. The rate of apoptotic cells was detected by flow cytometry. The apoptotic rate was calculated. X-axis: the level of Annexin-V FITC fluorescence; Y-axis: the PI fluorescence. (C) The protein expressions of cleaved caspase-3 and cleaved PARP were analysed by western-blot. β-actin was used as an internal control. (D, E) The relative protein expressions of cleaved caspase-3 (D) and cleaved PARP (E) were quantified by normalising to β-actin and statistically analysed. Data was reported as the mean ± SD. All experiments were performed three times. **p < 0.01, ***p < 0.001 versus control, and ▲p < 0.05, ▲▲p < 0.01 versus gefitinib group. G: Gefitinib; Y: YYJDD.
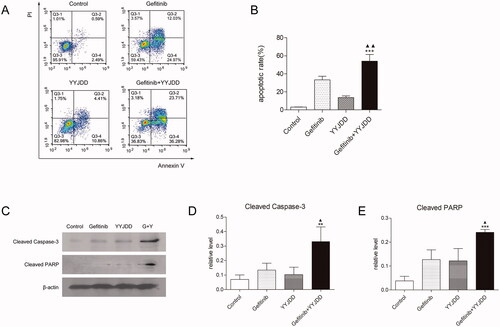
Figure 4. YYJDD reversed gefitinib resistance in H1975 cells via down-regulation of the PI3K/Akt signalling pathway. (A) H1975 cells were treated with gefitinib, YYJDD and combination therapy for 24 h. Then, the protein expressions of PI3K, p-PI3K, Akt and p-Akt were determined by western-blot. β-actin was used as an internal control. (B, C) The relative level of p-PI3K/PI3K (B) and p-Akt/Akt (C) were statistically analysed. (D) H1975 cells were pre-treated with LY294002, and then co-treated with YYJDD and combination therapy for a further 24 h. Cell viability was analysed by MTT assay. (E, F) Cell apoptosis was detected by flow cytometry. The apoptotic rate was calculated. X-axis: the level of Annexin-V FITC fluorescence; Y-axis: the PI fluorescence. (G) The protein expressions of Akt and p-Akt were determined by western-blot. β-actin was used as an internal control. (H) The relative level of p-Akt/Akt was statistically analysed. Data were presented as mean ± SD of three independent tests. *p < 0.05, **p < 0.01 and ***p < 0.001 versus control; ▲p < 0.05, ▲▲p < 0.01 versus gefitinib group; ▼▼▼p < 0.001 versus YYJDD; △△p < 0.01, △△△p < 0.001 versus gefitinib plus YYJDD. G: Gefitinib; Y: YYJDD; L: LY294002.
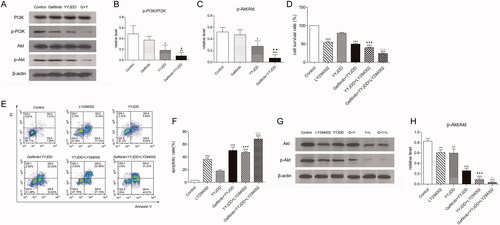
Figure 5. YYJDD overcame gefitinib resistance in vivo. H1975 cells were transplanted to BALB/c nude mice. The mice were randomly divided into four groups: control, gefitinib, YYJDD, and gefitinib + YYJDD group. (A) Tumour volumes of mice were measured every other day for 4 consecutive weeks. (B) The nude mice were sacrificed at the end of the 4th week and the tumours were collected. (C) The tumour tissues were weighed and calculated. (D) The body weights of mice were measured every other day for 4 consecutive weeks. (E) Apoptosis in tumour tissues was detected by TUNEL staining (original magnification, ×400). Green fluorescence indicated TUNEL staining; Blue fluorescence indicated DAPI staining. (F) TUNEL positive cell rate in each group was calculated involving at least five representative high-power fields. The final positive cells were the mean of at least five different mice tumour tissues in each group. Data were presented as mean ± SD. ***p < 0.01 compared to control group; ▲p < 0.05 and ▲▲▲p < 0.001 compared to gefitinib group. G: Gefitinib; Y: YYJDD.
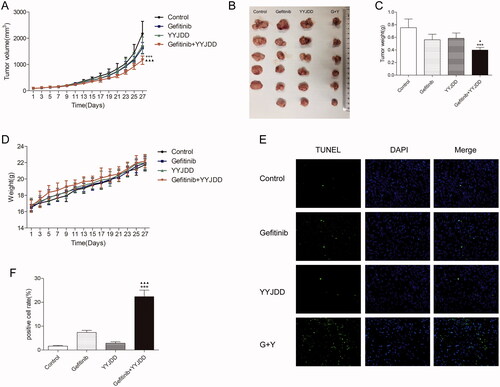
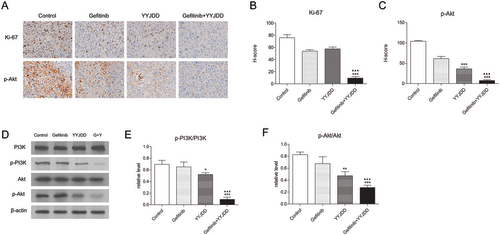
Figure 6. YYJDD overcame gefitinib resistance through the PI3K/Akt signalling pathway in vivo. (A) The expression of Ki-67 and p-Akt in tumour tissues of each group were detected by immunohistochemical staining. The level of protein expressions was estimated by counting at least 500 tumour cells in at least five representative high-power fields (original magnification, ×400). (B, C) The H-score of Ki-67 (B) and p-Akt (C) were calculated. (D) The protein expressions of PI3K, p-PI3K, Akt, and p-Akt in tumour tissues were determined by western-blot. β-actin was used as an internal control. (E, F) The relative level of p-PI3K/PI3K (E) and p-Akt/Akt (F) was calculated. Data were presented as mean ± SD. The final statistical results were the mean of at least five different mice tumour tissues in each group. *p < 0.05, **p < 0.01 and ***p < 0.001 versus control; ▲▲▲p < 0.001 versus gefitinib. G: Gefitinib; Y: YYJDD.
Data availability statement
The data that support the findings of this study are available on reasonable request from the corresponding author.