
Figures & data
Figure 1. Edaravone inhibits the cell death and apoptosis caused by high glucose. shows the cell viability of Müller cells after they were treated with different concentrations of glucose for different durations. shows the effect of different concentrations of edaravone on cell viability. shows the effect of different concentrations of edaravone on cell apoptosis. i) shows the representative images of apoptosis measured by flow cytometry. Eda: edaravone. *p < 0.05 compared to the control group. #p < 0.05 compared to the vehicle group. N = 12.
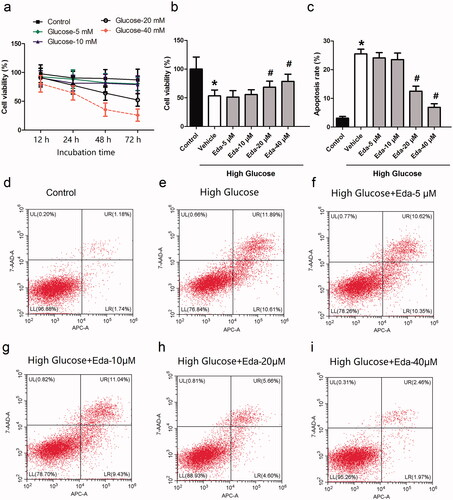
Figure 2. Edaravone changes the expression of apoptotic proteins. show the representative images of western blot bands of apoptotic proteins (cleaved caspase-3, caspase-3, cleavedcaspase-8, caspase-8, cleaved caspase-9, caspase-9, Bcl-xl and Mcl-1). shows the fold-change in the expression of apoptotic proteins. Eda: edaravone. *p < 0.05 compared to the control group. #p < 0.05 compared to the vehicle group. N = 12.
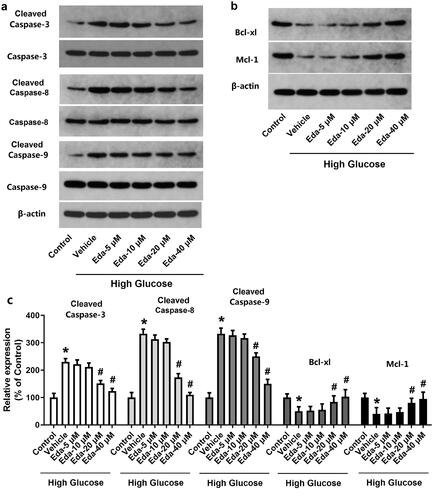
Figure 3. Edaravone inhibits oxidative stress in Müller cells cultured in high glucose. shows the changes in oxidative injury indicators (protein carbonyl, 8-OHdG and MDA). shows the changes in antioxidative enzyme activities (GPx, CAT and SOD). Eda: edaravone. 8-OHdG: 8-hydroxy-desoxyguanosine; MDA: malondialdehyde; GPx: glutathione peroxidase; CAT: catalase; SOD: superoxide dismutase. *p < 0.05 compared to the control group. #p < 0.05 compared to the vehicle group. N = 12.
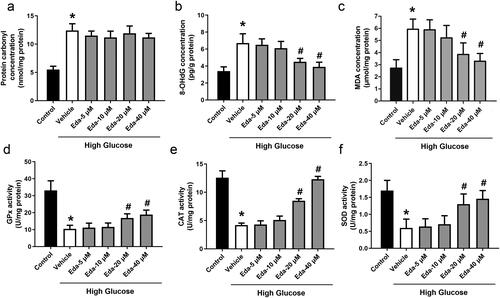
Figure 4. Edaravone reduces ROS levels and restores the mitochondrial membrane potential in Müller cells cultured in high glucose. shows the changes in DCF fluorescence signal. shows the changes in mitochondrial membrane potential. Eda: edaravone. DCF: 2′,7′-dichlorodihydrofluorescein. ROS: reactive oxygen species. *p < 0.05 compared to the control group. #p < 0.05 compared to the vehicle group. N = 12.
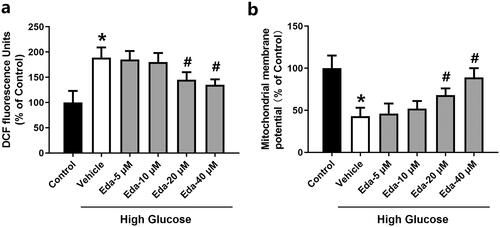
Figure 5. Edaravone alters the expression of TRX1, PGC-1α, NRF1 and TFAM and thioredoxin reductase activity. shows representative images of western blots of TRX1, PGC-1α, NRF1 and TFAM; shows the fold-change in the expression of these proteins compared with that of the control; shows the changes of thioredoxin reductase activity. TRX1: thioredoxin1; PGC-1α: peroxisome proliferator-activated receptorγcoactivator-1α; NRF1: Nuclear respiratory factor 1; TFAM: mitochondrial transcription factor A; Eda: edaravone. *p < 0.05 compared to the control group. #p < 0.05 compared to the vehicle group. N = 12.
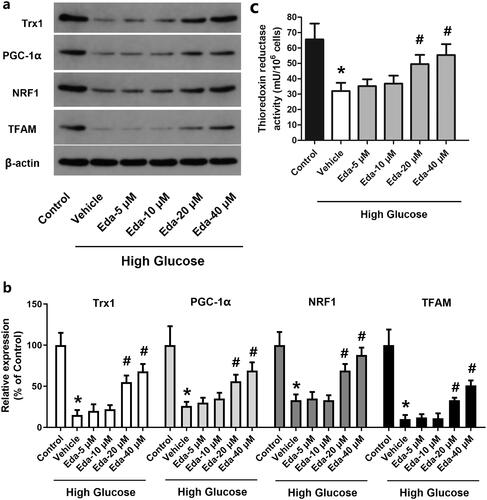
Figure 6. Effect of TRX1 overexpression or siRNA on cell viability, apoptosis, ROS levels and mitochondrial membrane potential in Müller cells. shows the effect of TRX1 overexpression or siRNA on cell viability. shows the effect of TRX1 overexpression or siRNA on cell apoptosis. shows the effect of TRX1 overexpression or siRNA on ROS levels. shows the effect of TRX1 overexpression or siRNA on mitochondrial membrane potential. TRX1: thioredoxin1; ROS: reactive oxygen species. #p < 0.05 between groups. N = 12.
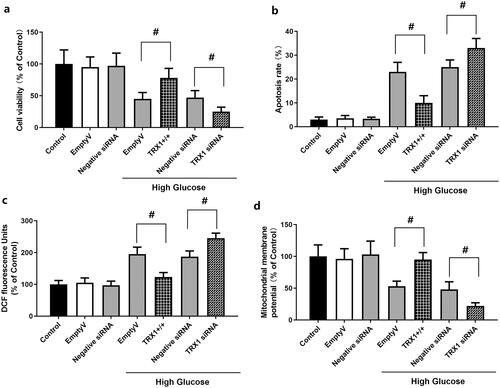
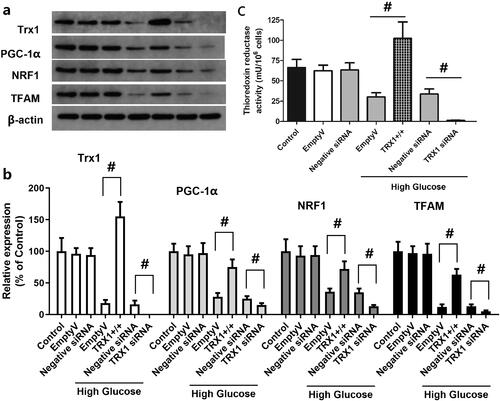
Figure 7. Effect of TRX1 overexpression or siRNA on the expression of TRX1, PGC-1α, NRF1 and TFAM and thioredoxin reductase activity. shows representative western blot images of TRX1, PGC-1α, NRF1 and TFAM; shows the fold-change in the expression of these proteins compared with that of the control; shows the changes of thioredoxin reductase activity. TRX1 overexpression significantly increased the expression of TRX1, PGC-1α, NRF1 and TFAM and thioredoxin reductase activity; TRX1 siRNA significantly decreased their expression and the thioredoxin reductase activity compared with that of the negative control siRNA. TRX1: thioredoxin1; PGC-1α: peroxisome proliferator-activated receptorγcoactivator-1α; NRF1: Nuclear respiratory factor 1; TFAM: mitochondrial transcription factor A; Eda: edaravone. #p < 0.05 between groups. N = 12.
Data availability statement
The datasets used and/or analysed during the current study are available from the corresponding author on reasonable request.