Figures & data
Table 1. Primer sequences used in qRT-PCR experiment.
Figure 1. EGCG reverses cardiac hypertrophy in mice with TAC. (A) Heart weight to body weight (HW/BW) ratio. (B) Heart weight to tibia length (HW/TL) ratio. (C) H&E staining of different groups. **p < 0.01 as compared with the sham group. #p < 0.05, ##p < 0.01 as compared with the TAC group.
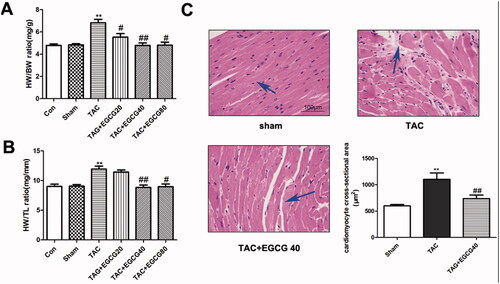
Figure 2. EGCG improves cardiac function in mice with TAC. Hemodynamic parameters (LVSP (A), LVEDP (B), -dp/dt (C), MAP (D), Vmean (E)) of mice in different groups were detected, respectively. The levels of CK-MB (F), cTnT (G), and cTnI (H) in the serum were detected by kits. *p < 0.05, **p < 0.01, as compared with the sham group. #p < 0.05 as compared with the TAC group.
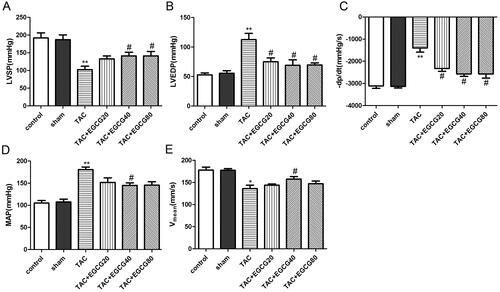
Figure 3. EGCG reduces the expression of hypertrophic marker genes in mice with TAC. (A) Western blot assay for protein expression of hypertrophic markers. (B) QRT-PCR assay for mRNA expressions of hypertrophic markers. *p < 0.05, **p < 0.01, ***p < 0.001 as compared with the sham group. #p < 0.05 as compared with the TAC group.
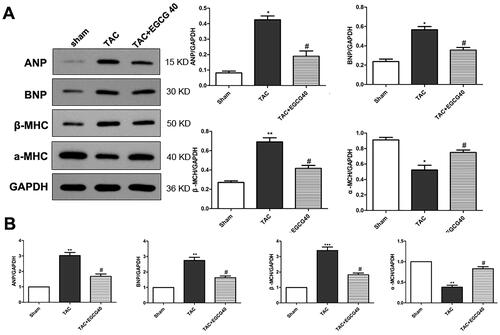
Figure 4. EGCG reduces fibrotic and condensed collagen-deposition areas in mice with TAC. (A) Masson’s trichrome staining of different groups. (B) Sirius red staining of different groups. ***p < 0.001 as compared with the sham group. ##p < 0.01 as compared with the TAC group.
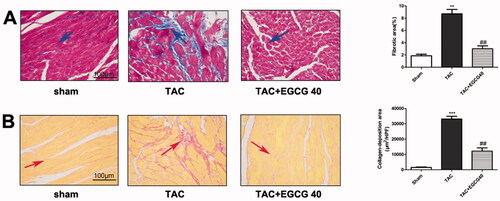
Figure 5. EGCG attenuates expression of cardiac fibrosis marker genes in mice with TAC. Western blot assay for protein expression of cardiac fibrosis markers. (B) QRT-PCR assay for mRNA expression of cardiac fibrosis markers. *p < 0.05, **p < 0.01 as compared with the sham group. #p < 0.05 as compared with the TAC group.
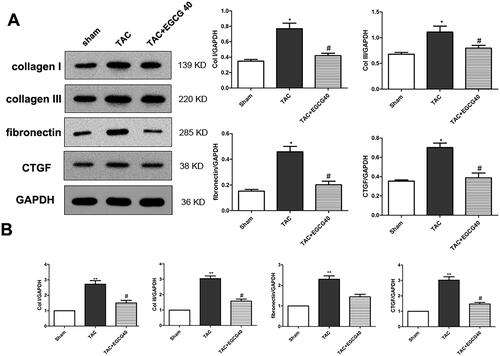
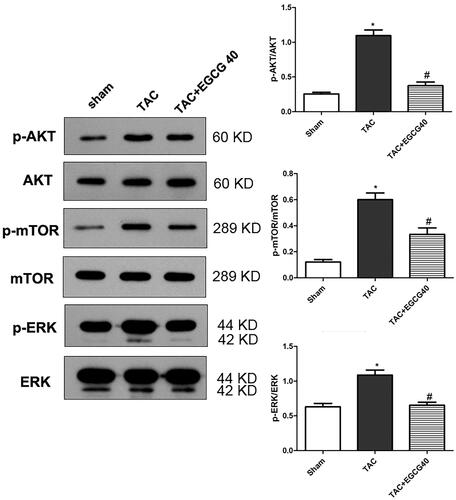
Figure 6. EGCG attenuates the activation of AKT/mTOR signalling and ERK1/2 phosphorylation in mice with TAC. *p < 0.05 as compared with the sham group. #p < 0.05 as compared with the TAC group.