Figures & data
Figure 1. The schematic diagram of the treatment schedule.
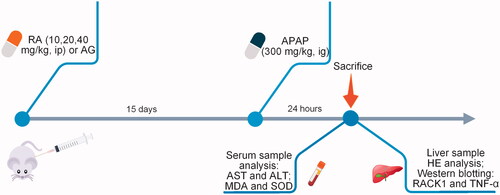
Figure 2. Protective effects of rosmarinic acid on APAP-induced acute liver injury in mice. (a) Histology. Histological examination of liver tissue was performed 24 h after 300 mg/kg APAP administration. Liver tissues were fixed, sectioned at 4 μm thickness, and stained with haematoxylin–eosin (HE). Representative HE (left panel) stained sections of the liver of mice in the control group (Con), APAP group, APAP + ammonium glycyrrhetate group (AG), APAP + RA (10 mg/kg) group (LRA), APAP + RA (20 mg/kg) group (MRA) and APAP + RA (40 mg/kg) group (HRA) (magnification ×200); Histological scores (right panel) were evaluated by an experienced pathologist in a blinded manner under light microscopy (n = 5). Triangles display vacuolization. The arrows represent the necrosis with the abnormal structure of hepatic lobules. The hollow arrows show the mononuclear cell infiltration. (b) Serum alanine aminotransferase (ALT) (n = 10). (c) Serum aspartate aminotransferase (AST) (n = 10). Values are presented as mean ± S.E.M. *p < 0.05 vs. control group. #p < 0.01 vs. APAP group.
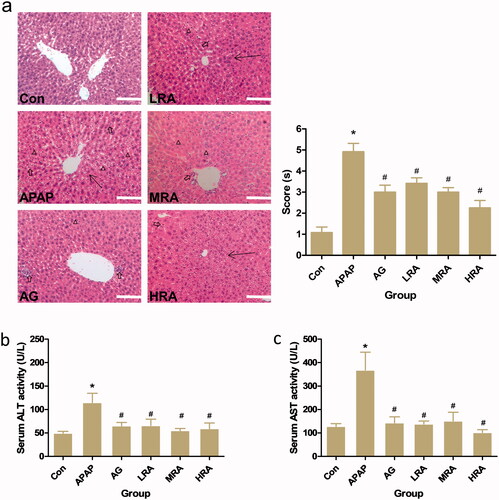
Figure 3. Protective effects of rosmarinic acid on oxidative stress parameters. (a) Serum malondialdehyde (MDA) content; (b) serum superoxide dismutase (SOD). Values are presented as mean ± S.E.M. *p < 0.05, vs. control group (n = 10). #p < 0.01 vs. APAP group (n = 10).
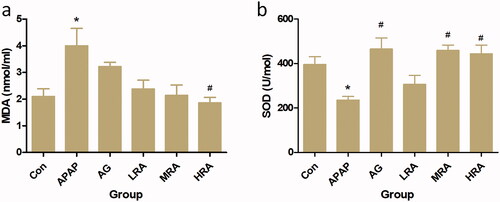
Figure 4. Effects of rosmarinic acid on RACK1/TNF-α signalling pathway. (a) The protein expression of TNF-α and RACK1 were analysed by western blotting. β-actin was used as an internal standard. (b) The relative level of TNF-α in liver. The results were expressed as the ratio of the investigated gene to β-actin. (c) Positive correlation of TNF-α protein level with serum MDA (r = 0.9391, p < 0.01). (d) Molecular docking result of RACK1 and RA. The crystal structure of RACK1 was blue and RA was yellow. The binding energy of RACK1 and RA was –7.4 kcal/mol. (e) The relative level of RACK1 in liver. The results were expressed as the ratio of the investigated gene to β-actin. (f) Positive correlation of RACK1 protein level with serum MDA (r = 0.8453, p < 0.01). (g) Positive correlation of RACK1 protein level with TNF-α protein level (r = 0.6778, p < 0.01). Values are presented as mean ± S.E.M. *p < 0.05 vs. control group (n = 8). #p < 0.01 vs. APAP group (n = 8).
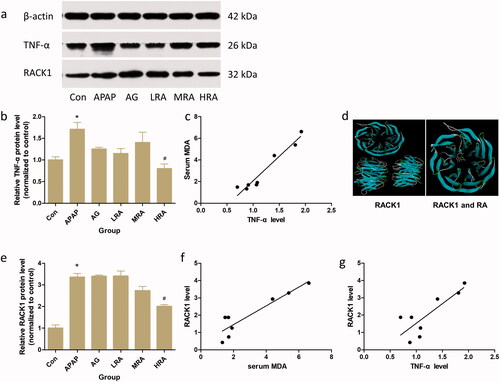
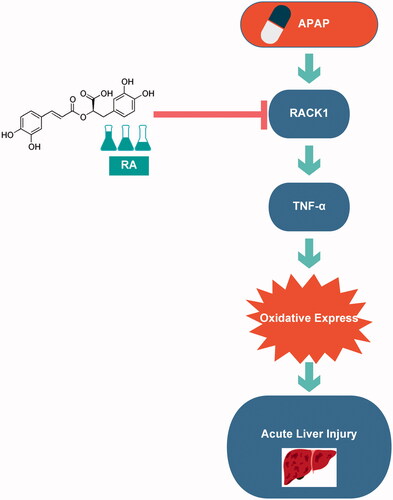
Figure 5. Graphical summary of the results. On exposure to APAP overdose, overexpression of RACK1 directly induced oxidative stress via TNF-α to prompt APAP hepatotoxicity. Rosmarinic acid suppresses oxidative stress by inhibiting the RACK1/TNF-α signalling pathway in APAP overdose induced acute liver injury.