Figures & data
Table 1. The oven temperature program of GCMS–QP 2010.
Table 2. Mass spectra properties of 8 compounds and tolbutamide (IS).
Figure 1. The TIC chromatogram of UPLC-MS in both positive mode (A) and negative mode (B) for TWMM.
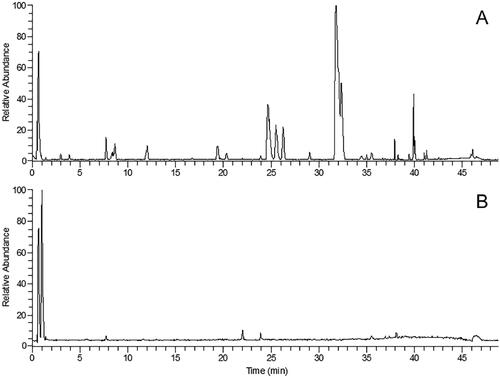
Table 3. Compounds in TWMM detected by LC/MS in positive ion mode.
Table 4. Compounds in TWMM detected by LC/MS in negative ion mode.
Figure 2. The TIC chromatogram of GC-MS for TWMM.
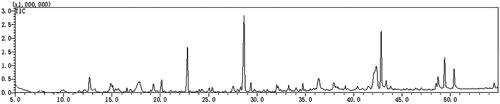
Table 5. Compounds in TWMM detected by GC/MS.
Figure 3. The PPI network of 57 intersection gene targets (colour indicates query proteins and first shell of interactors; filled nodes indicate some 3D structure is known or predicted; line thickness indicates the strength of data support).
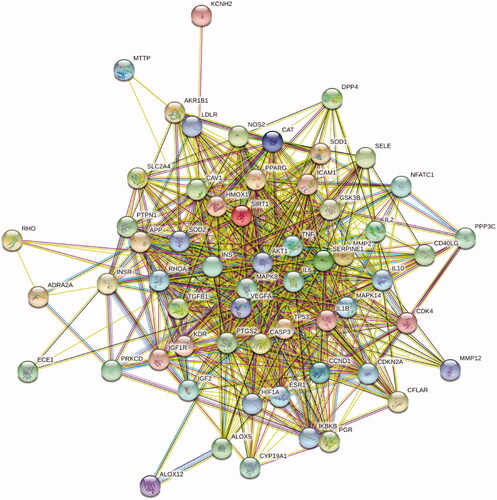
Figure 4. The 27 predicted key targets of TWMM in the therapy of DR (point size represents the degree value; colour from red to green represents the correlation from high to low).
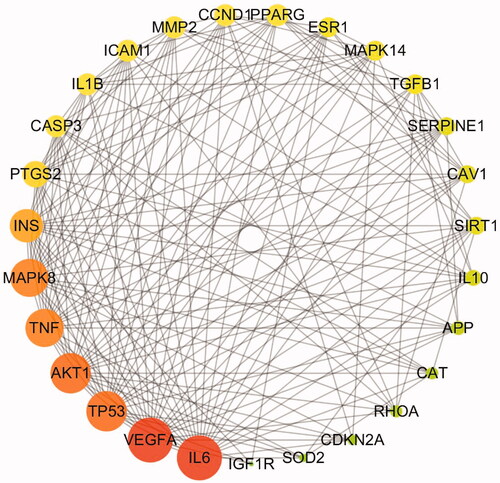
Table 6. The core targets of TWMM in treating diabetic retinopathy.
Figure 5. The core analysis of early DR treated with TWMM (–Log p-value represents the pathway correlation; ratio represents the ratio of the number of molecules to the total number of molecules in the pathway).
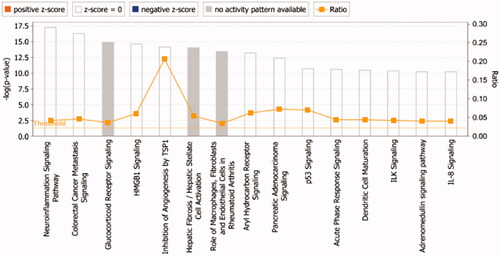
Figure 6. The map of diseases & functions (darker colour indicates smaller p-value).
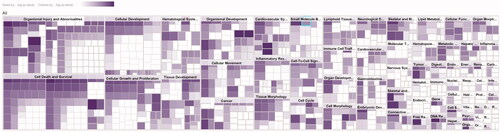
Figure 7. The compound-target-pathway network of TWMM in the treatment of DR (the left circle represents compounds; the outer circle of the right side represents the gene targets; the inner circle of the right side represents related pathways; point size from big to small represents the correlation from high to low).
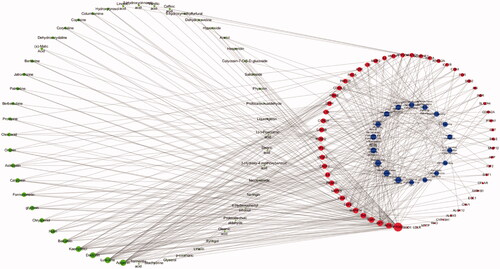
Figure 8. MRM chromatograms of tolbutamide (a), formononetin (b), chlorogenic acid (c), linarin (d), oleuropein (e), luteolin (f), jaspolyside (g), specnuezhenide (h) and verbascoside (i). (1) Blank plasma, (2) blank plasma spiked with the analytes and IS, (3) plasma sample after oral administration of TWMM.
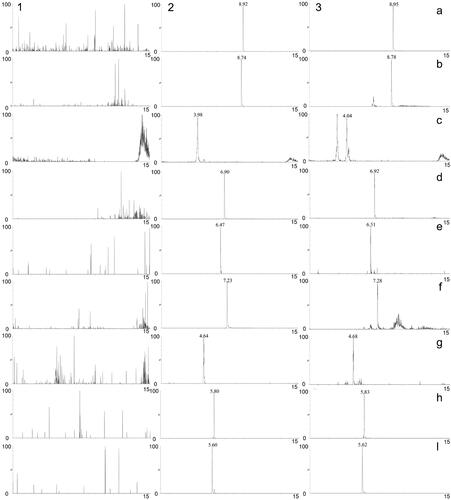
Table 7. Calibration curves, correlation coefficients, linear ranges and LLOQ of 8 compounds.
Table 8. Precision and accuracy of 8 compounds in rat plasma (n = 6).
Table 9. Extraction recoveries and matrix effects of 8 compounds (n = 6).
Table 10. Stability of 8 compounds in rat plasma (n = 3).
Figure 9. Plasma concentration–time curves of 8 compounds after oral administration of TWMM (n = 6, mean ± SD).
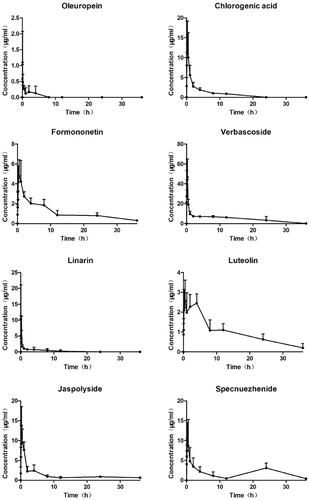
Table 11. Pharmacokinetic parameters of 8 compounds after oral administration of TWMM (n = 6).
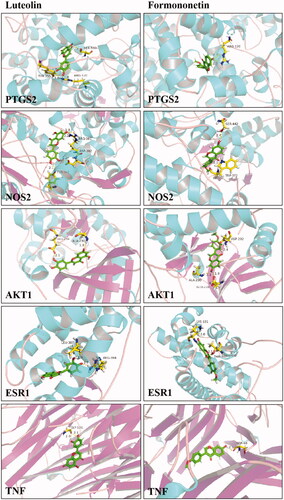
Figure 10. The 3D interaction diagrams of luteolin and formononetin.