Figures & data
Table 1. Primer sequences.
Table 2. Gait scores at different time points.
Table 3. Changes in the ankle swelling index at different time points.
Figure 1. Effects of isovitexin on synovial tissues visualized using haematoxylin and eosin and Masson staining (×200). (A) Haematoxylin and eosin staining; (B) Masson staining.
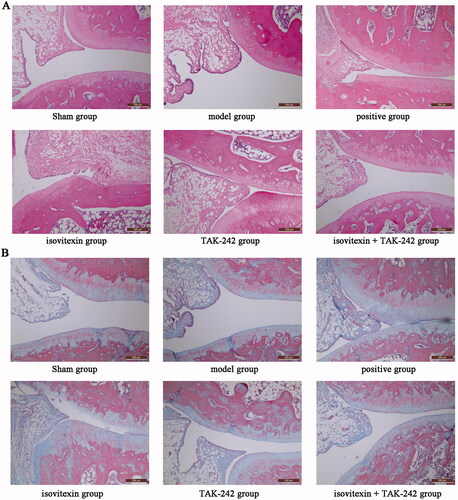
Table 4. Joint tissue injury score.
Figure 2. Comparison of the inflammation index in each group. Serum levels of (A) TNF-α; (B) IL-6; (C) IL-1β. *p < 0.05 compared with the sham group, **p < 0.01 compared with the sham group; #p < 0.05 compared with the model group, ##p < 0.01 compared with the model group; &p < 0.05 compared with the positive group; ^p < 0.05 compared with the isovitexin group, ^^p < 0.01 compared with the isovitexin group; ★p < 0.05 compared with the TAK-242 group.
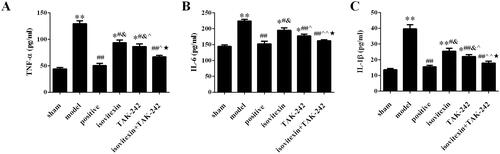
Figure 3. Expression of TLR4 and MyD88. Expression of (A) TLR4 mRNA. (B) MyD88 mRNA. (C) Representative images of western blot analysis. Relative protein expression levels of (D) of TLR4; (E) MyD88. *p < 0.05 compared with the sham group, **p < 0.01 compared with the sham group; #p < 0.05 compared with the model group, ##p < 0.01 compared with the model group; &p < 0.05 compared with the positive group; ^p < 0.05 compared with the isovitexin group, ^^p < 0.01 compared with the isovitexin group; ★p < 0.05 compared with the TAK-242 group.
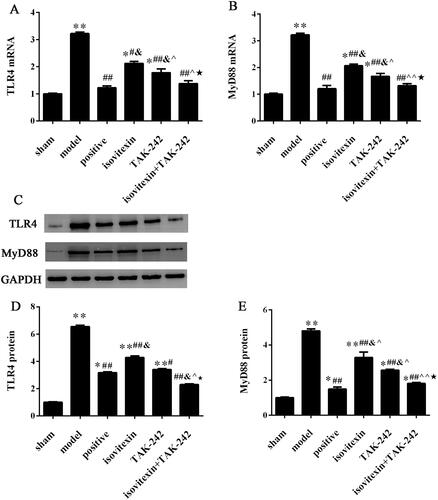
Figure 4. Immunohistochemical detection of TLR4 and MyD88 expression in the synovial tissue (magnification, ×200; scale bar: 200 μm). (A) Immunohistochemical analysis of TLR4 in each group. (B) Percentage of cells positive for TLR4. (C) Immunohistochemical analysis of MyD88 in each group. (D) Percentage of cells positive for MyD88. *p < 0.05 compared with the sham group, **p < 0.01 compared with the sham group; ##p < 0.01 compared with the model group; &p < 0.05 compared with the positive group; ^p < 0.05 compared with the isovitexin group, ^^p < 0.01 compared with the isovitexin group; ★p < 0.05 compared with the TAK-242 group.
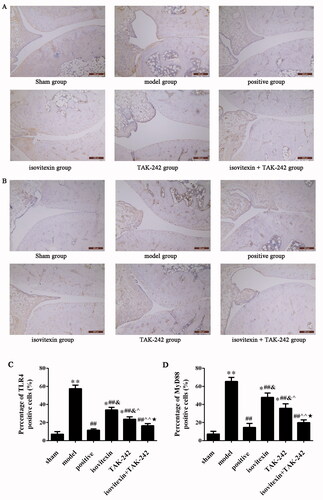
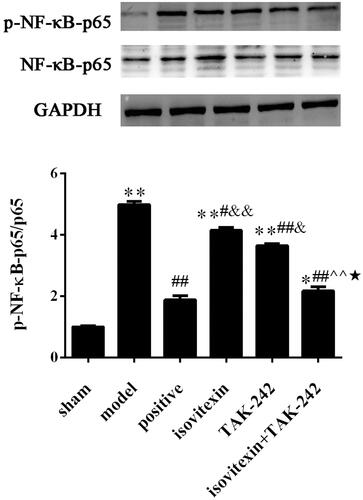
Figure 5. Level of p-NF-κB-p65. (A) Representative images of western blot analysis. (B) Relative protein expression levels of NF-κB. *p < 0.05 compared with the sham group, **p < 0.01 compared with the sham group; #p < 0.05 compared with the model group, ##p < 0.01 compared with the model group; &p < 0.05 compared with the positive group, &&p < 0.01 compared with the positive group; ^^p < 0.01 compared with the isovitexin group; ★p < 0.05 compared with the TAK-242 group.