Figures & data
Figure 1. The compound-target network of C. Flos. The ellipse in purple indicates the bioactive compounds and the rectangle in green indicates potential targets.
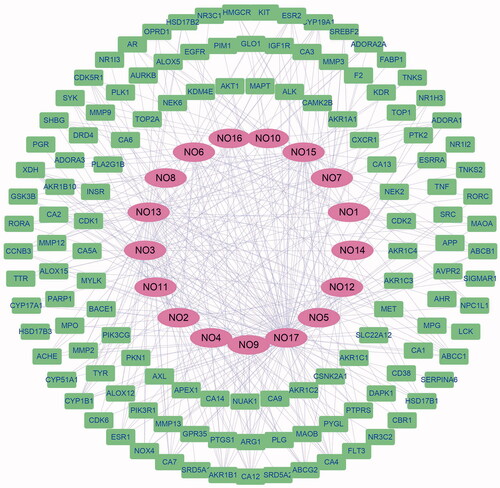
Table 1. The bioactive compounds in Chrysanthemum Flos collected from TCMSP database.
Figure 2. The protein–protein interaction (PPI) of the common targets. The protein with higher degree was presented with larger node and darker colour.
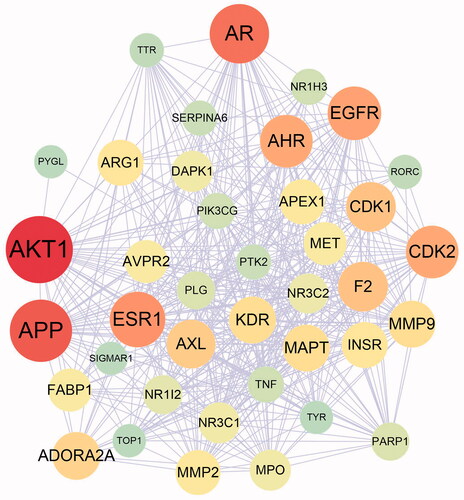
Table 2. The main pathways and biological processes in KEGG and GO enrichment analysis.
Figure 3. The effects of BZE on APAP-induced liver injury and oxidative stress. (A, B) The levels of ALT and AST; (C) the representative images of liver H&E staining (bar = 100 μm); (D–F) the measurement of ROS in liver, and SOD and GSH in serum of rats (means ± SD, n = 6); ##p < 0.01 compared to control group; *p < 0.05, **p < 0.01 compared to APAP group. APAP: acetaminophen; BZE: extract of Bianliang ziyu flower.
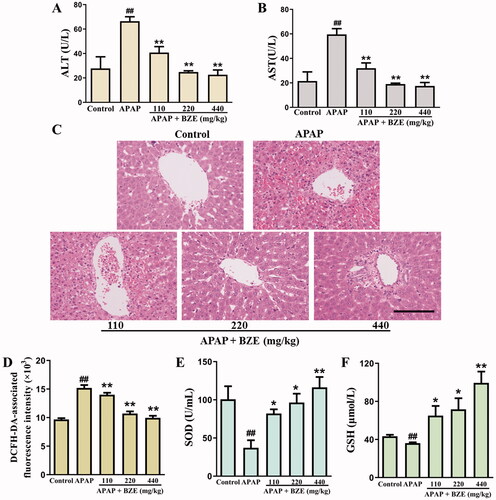
Figure 4. Effects of BZE on the AMPK/GSK3β–Nrf2 antioxidant signalling pathway. (A, D) The representative protein bands; (B, C and E–H) relative expression levels of p-AMPK, p-GSK3β, Nrf2 (cytoplasm), Nrf2 (nuclear), HO-1 and NQO1 (means ± SD, n = 3); #p < 0.05, ##p < 0.01 compared to control group; *p < 0.05, **p < 0.01 compared to APAP group. APAP: acetaminophen; BZE: extract of Bianliang ziyu flower.
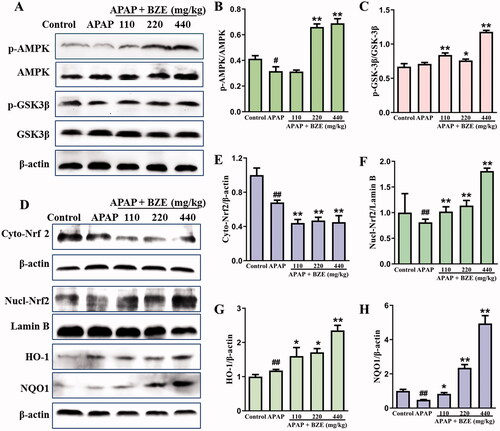
Figure 5. Effects of BZE on PI3K–Akt pathway and APAP-induced apoptosis. (A) Representative protein bands; (B–E) the relative expression levels of p-Akt, caspase-3, Bax and Bcl-2 (means ± SD, n = 6); ##p < 0.01 compared to control group; *p < 0.05, **p < 0.01 compared to APAP group. APAP: acetaminophen; BZE: extract of Bianliang ziyu flower.
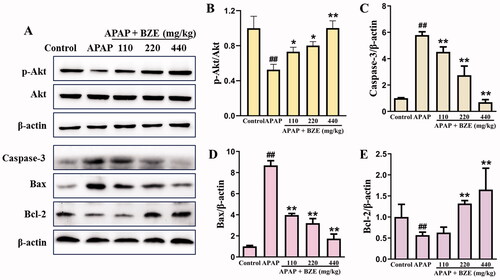
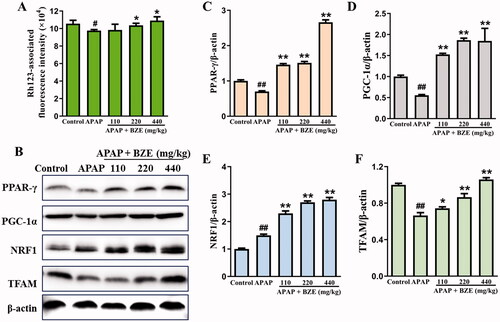
Figure 6. Effects of BZE on the APAP-induced mitochondrial membrane potential and mitochondrial biosynthesis-related proteins. (A) The measurement of mitochondrial membrane potential; (B) representative protein bands; (C–F) the relative expression levels of PPAR-γ, PGC-1α, NRF1 and TFAM (means ± SD, n = 6). #p < 0.05, ##p < 0.01 compared to control group; *p < 0.05, **p < 0.01 compared to APAP group. APAP: acetaminophen; BZE: extract of Bianliang ziyu flower.