Figures & data
Figure 1. Rat treatment and experimental flow chart.
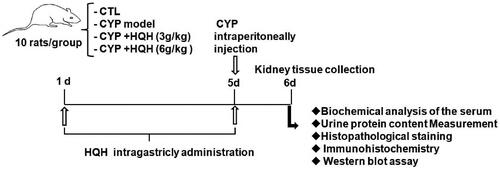
Figure 2. Effects of HQH on functional marker and morphological change in the kidneys of CYP-treated rats. (A) Serum creatinine. (B) Blood urea nitrogen. (C) Urine protein. (D) Kidney sections stained with H&E (magnification ×200 and ×400). The data are presented as the mean ± SD. n = 4. ***p < 0.001 versus the Control group. #p < 0.05, ##p < 0.01, and ###p < 0.001 versus the CYP group.
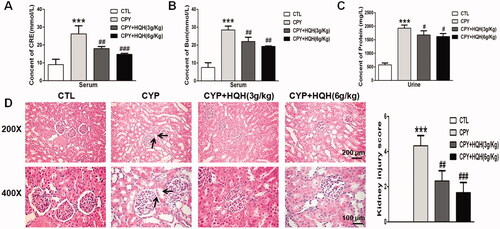
Figure 3. Effect of HQH on MDA levels and antioxidant enzyme activity in serum. (A) MDA levels. (B) CAT activity. (C) SOD activity. Data are shown as mean ± SD, n = 4. *p < 0.05 and **p < 0.01 versus the Control group. #p < 0.05, ##p < 0.01, and ###p < 0.001 versus the CYP group.
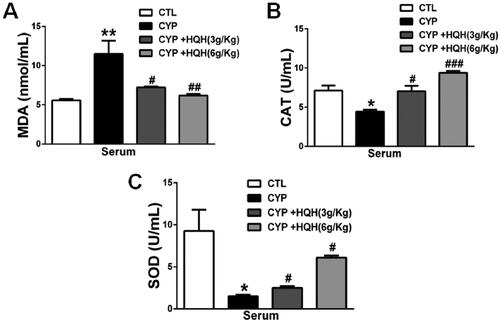
Figure 4. Effect of HQH on the apoptosis-related protein levels in the kidneys of CYP-treated rats. Western blot was used to test the protein expressions. (A) Representative images of cleaved-caspase3, cleaved-caspase9, Bcl2 and Bax were shown. (B) The levels of cleaved-caspase3. (C) The levels of cleaved-caspase9. (D) The ratio of Bcl2/Bax. Data are shown as mean ± SD, n = 4. *p < 0.05 and ***p < 0.001 versus the Control group. #p < 0.05, ##p < 0.01 and ###p < 0.001 versus the CYP group.
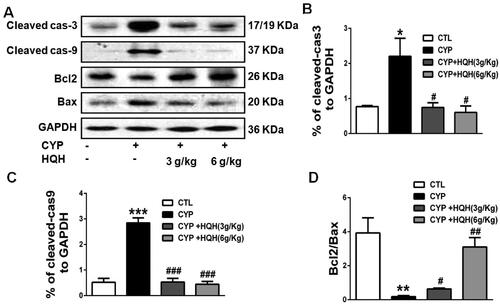
Figure 5. Effect of HQH on the inflammatory cytokines levels in the kidneys of CYP-treated rats. The expressions of TNF-α, IL-1β and IL-6 were determined by western blot (A) The levels of TNF-α. (B) The levels of IL-1β. (C) The levels of IL-6. Data are shown as mean ± SD, n = 4. **p < 0.01 and ***p < 0.001 versus the Control group. #p < 0.05 and ###p < 0.001 versus the CYP group.
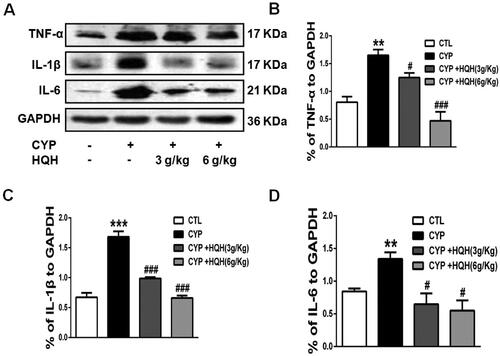
Figure 6. Effect of HQH on protein expression in the MAPK/NF-κB pathway in the kidneys of CYP-treated rats. (A) Phosphorylated p38, JNK, ERK and p65 expression was determined by western blot and representative images of protein bands were shown. (B) The levels of p-p38. (C) The levels of p-JNK. (D) The levels of p-ERK. (E) The levels of p-p65. Data are shown as mean ± SD, n = 4. *p < 0.05 and ***p < 0.001 versus theControl group. #p < 0.05 and ##p < 0.01 versus the CYP group.
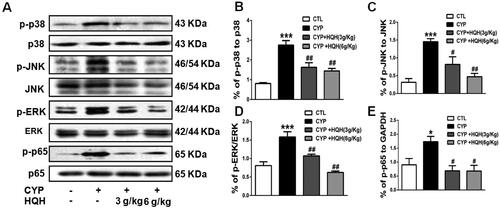
Figure 7. Effect of HQH on protein expression on the NLRP3 inflammatory pathway in the kidneys of CYP-treated rats. (A) The expression levels of NLRP3, ASC and Caspase-1 were determined by western blot representative images of protein bands were shown. (B) The levels of NLRP3. (C) The levels of ASC. (D) The levels of Caspase-1. (E) Immunohistochemistry analysis of NLRP3 and representative images were shown. Data are shown as mean ± SD, n = 4. ***p < 0.001 versus the Control group. ##p < 0.01 and ###p < 0.001 versus the CYP group.
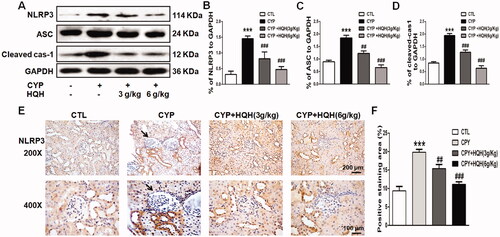
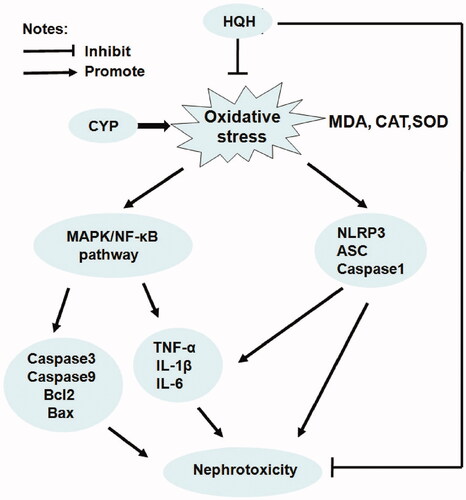
Figure 8. Proposed mechanisms of HQH-mediated protection to CYP-induced nephrotoxicity in rats.