Figures & data
Figure 1. The study groups’ (A) body weights and (B) fasting blood glucose (FBG) levels at the end of 15 weeks. The diabetic groups treated with CNME or metformin increased in body weight and had reduced FBG levels compared to the untreated diabetic group. Data are presented as mean ± SEM (n = 12). ap < 0.05 vs. C group. bp < 0.05 vs. DM group. Non-diabetic control group: C; non-diabetic group treated with 500 mg/kg CNME: C + CNME; untreated diabetic group: DM; diabetic group treated with 300 mg/kg metformin: DM + Met; diabetic group treated with 500 mg/kg CNME: DM + CNME.
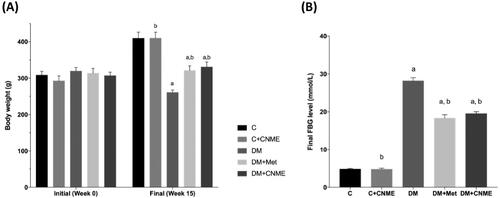
Table 1. Levels of TC, TG, HDL-C, LDL-C and atherogenic index in serum of rats at week 15.
Figure 2. (A) MDA and (B) SOD levels in the thoracic aortas of non-diabetic and diabetic rats. The diabetic groups treated with CNME or metformin had reduced MDA and increased SOD activity compared to the untreated diabetic group. Data are presented as mean ± SEM (n = 12). #p < 0.05, ##p < 0.01 vs. C group. *p < 0.05, **p < 0.01 vs. DM group. Non-diabetic control group: C; non-diabetic group treated with 500 mg/kg CNME: C + CNME; untreated diabetic group: DM; diabetic group treated with 300 mg/kg metformin: DM + Met; diabetic group treated with 500 mg/kg CNME: DM + CNME.
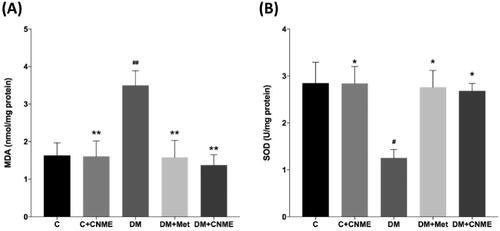
Figure 3. TNF-α levels in the study group’s thoracic aortas. The diabetic groups treated with CNME or metformin had reduced vascular TNF-α levels compared to the untreated diabetic group. Data are presented as mean ± SEM (n = 12). ####p < 0.0001 vs. C group. **p < 0.01, ***p < 0.001 vs. DM group. Non-diabetic control group: C; non-diabetic group treated with 500 mg/kg CNME: C + CNME; untreated diabetic group: DM; diabetic group treated with 300 mg/kg metformin: DM + Met; diabetic group treated with 500 mg/kg CNME: DM + CNME.
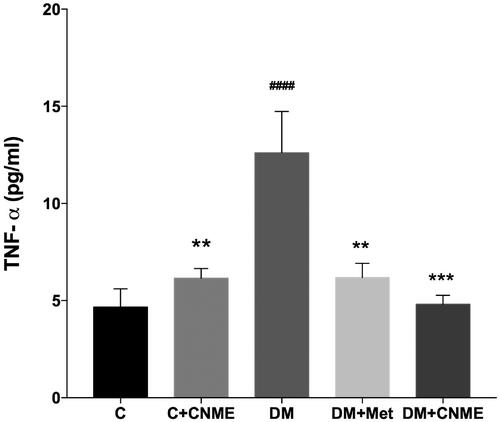
Figure 4. Histopathological changes in the rats’ thoracic aortas after 4 weeks of CNME treatment (magnification, ×400). (A) The non-diabetic control group (C) showed an intact vascular layer and no impairment of the vessel wall. (B) The non-diabetic group treated with 500 mg/kg CNME (C + CNME) showed an intact vascular layer and no impairment to vessel integrity. (C) In the untreated diabetic group (DM), the aortas appeared to be thick and exhibited disorientation of the smooth muscle cells with foam cell formation. (D) In the diabetic group treated with 300 mg/kg metformin (DM + Met), the aortas showed a thinner vascular wall compared to the untreated diabetic group’s aortas with no foam cell formation. (E) In the diabetic group treated with 500 mg/kg CNME (DM + CNME), the aortas had a thinner vascular wall compared to the untreated diabetic aortas, no impairment of the vascular wall, and no foam cell formation. The double arrow shows the IMT measurement, the red arrows indicate the foam cells, L represents the vascular lumen, and M indicates Media.
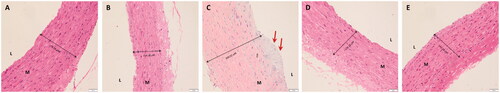
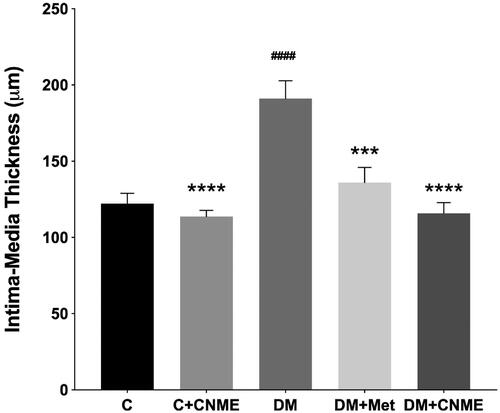
Figure 5. IMT of the thoracic aorta in the non-diabetic and diabetic rats treated with CNME. The diabetic groups treated with CNME or metformin had reduced aortic IMT compared to the untreated diabetic group. Data are presented as mean ± SEM (n = 12). ####p < 0.0001 vs. C group. ***p < 0.001, ****p < 0.0001 vs. DM group. Non-diabetic control group: C; non-diabetic group treated with 500 mg/kg CNME: C + CNME; untreated diabetic group: DM; diabetic group treated with 300 mg/kg metformin: DM + Met; diabetic group treated with 500 mg/kg CNME: DM + CNME.