
Figures & data
Figure 1. APS enhanced M1 macrophage proportions and reduced M2 macrophage proportions in TAMs. The qRT-PCR was performed to assess the expression of IL-10 (A), Arg-1 (B), iNOS (C), IL-1β (D) and TNF-α (E) in TAMs following the treatment of different concentrations of APS (0, 8, 16 mg/mL). (F–G) Flow cytometry was performed to estimate the proportions of M1 and M2 macrophages in TAMs following the treatment of different concentrations of APS (0, 8, 16 mg/mL). *p < 0.05 vs. 0 mg/mL; #p < 0.05 vs. 8 mg/mL.
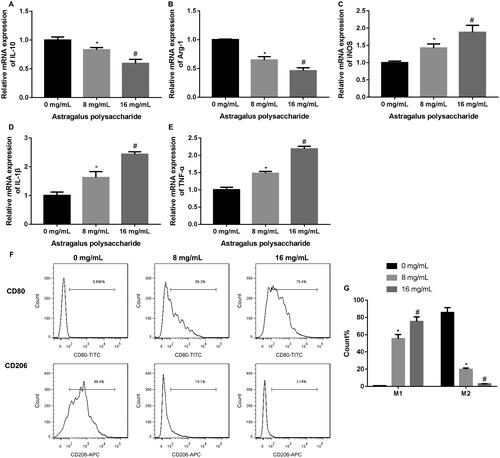
Figure 2. APS-treated TAMs promoted cell proliferation, migration and invasion of MHCC97H and Huh7 cells. TAMs were treated with PBS or 16 mg/mL APS, denoted as [TAM (0 mg/mL)] or [TAM (16 mg/mL)]. MHCC97H and Huh7 cells were co-cultured with THP-1 macrophages (M0), [TAM (0 mg/mL)] or [TAM (16 mg/mL)]. (A–B) CCK-8 assay was performed to examine cell proliferation of MHCC97H and Huh7 cells. (C–E) Cell migration of MHCC97H and Huh7 cells was assessed by Transwell migration assay. (F–H) Cell invasion of MHCC97H and Huh7 cells was detected by Transwell invasion assay. #p < 0.05 vs. M0; *p < 0.05 vs. TAM (0 mg/mL).
![Figure 2. APS-treated TAMs promoted cell proliferation, migration and invasion of MHCC97H and Huh7 cells. TAMs were treated with PBS or 16 mg/mL APS, denoted as [TAM (0 mg/mL)] or [TAM (16 mg/mL)]. MHCC97H and Huh7 cells were co-cultured with THP-1 macrophages (M0), [TAM (0 mg/mL)] or [TAM (16 mg/mL)]. (A–B) CCK-8 assay was performed to examine cell proliferation of MHCC97H and Huh7 cells. (C–E) Cell migration of MHCC97H and Huh7 cells was assessed by Transwell migration assay. (F–H) Cell invasion of MHCC97H and Huh7 cells was detected by Transwell invasion assay. #p < 0.05 vs. M0; *p < 0.05 vs. TAM (0 mg/mL).](/cms/asset/3657d1bb-74f4-4f92-acf2-7c33e0a6fa65/iphb_a_1991384_f0002_c.jpg)
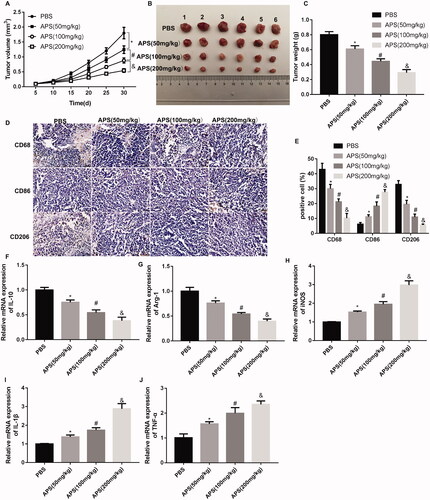
Figure 3. APS inhibited tumour growth in HCC by regulating polarization of TAMs. Tumour xenograft mouse model was constructed by inoculation of Huh7 cells, followed by administration of different concentration of APS (50, 100, 200 mg/kg) or PBS. The volume (A-B) and weight (C) of tumour were measured. (D-E) The expression of CD68 (macrophage marker), CD86 (M1 macrophage marker) and CD206 (M2 macrophage marker) in tumour tissues was assessed by IHC staining. The qRT-PCR was performed to assess the expression of IL-10 (F), Arg-1 (G), iNOS (H), IL-1β (I) and TNF-α (J) in tumour tissues. *p < 0.05 vs. PBS; #p < 0.05 vs. APS (50 mg/kg); &p < 0.05 vs. APS (100 mg/kg).