Figures & data
Figure 1. Quantitative analysis of major compounds in QLY granules. HPLC chromatograms. (A) Standard solution of berberine. (B) Extract of Qingluoyin granules. (C) Standard solution of oxymatrine. (D) Extract of Qingluoyin granules. (E) Standard solution of sinomenine. (F) Extract of Qingluoyin granules.
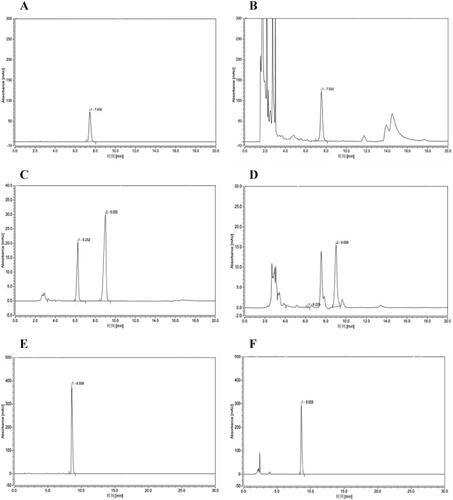
Table 1. Determination results of three ingredients in QLY granules/mg g−1.
Figure 2. Effects of QLY granules on arthritis signs in AA rats. (A) The global assessment of AA rats. (B) The arthritis index of AA rats. (C) The swollen joint count of AA rats. (D) The paw swelling of AA rats. Data are expressed as the mean ± SD, with 10 animals in each group. **p < 0.01 vs. normal; #p < 0.05, ##p < 0.01 vs. model.
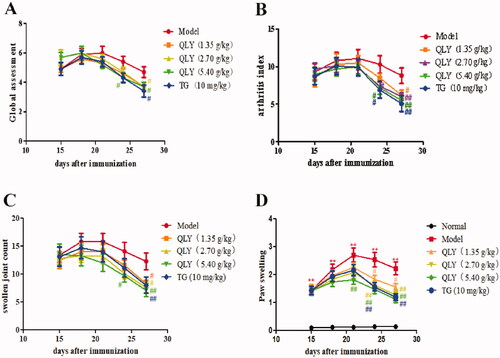
Figure 3. Effects of QLY granules on thymus and spleen indexes. Data are expressed as the mean ± SD, with 10 animals in each group. *p < 0.05, **p < 0.01 vs. normal; #p < 0.05 vs. model.
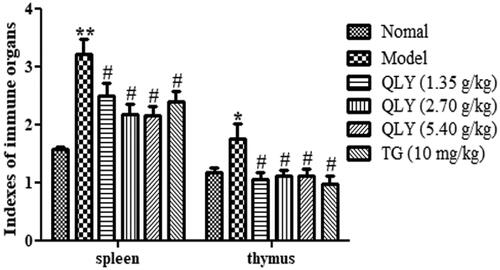
Figure 4. Effects of QLY granules on histopathology of AA joints. The histopathology examinations in joints were observed by H&E staining. (A) Representative histological changes of haematoxylin and eosin-stained sections of the joints (magnification × 400). a: normal; b: model; c: QLY granules (1.35 g/kg); d: QLY granules (2.70 g/kg); e: QLY granules (5.40 g/kg); f: TG (10 mg/kg). (B) Histopathological evaluation of the synovium from the AA rats. The histological appearance was scored for the presence of synovial proliferation, infiltrated inflammatory cells, pannus formation, and cartilage erosion. Data are expressed as the mean ± SD, with 5 animals in each group. **p < 0.01 vs. normal; #p < 0.05, ##p < 0.01 vs. model.
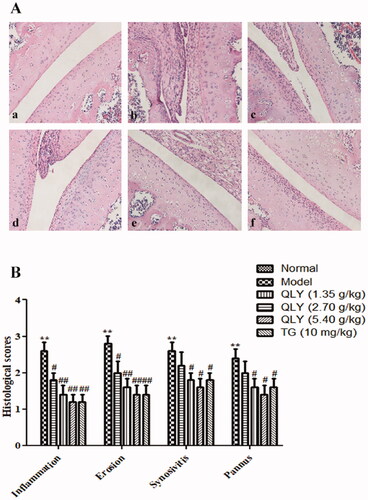
Figure 5. Effects of QLY granules on AA spleen histopathology. (A) Representative micrographs of H&E-stained histological sections of the spleens are shown (magnification × 400). a: normal; b: model; c: QLY granules (1.35 g/kg); d: QLY granules (2.70 g/kg); e: QLY granules (5.40 g/kg); f: TG (10 mg/kg). (B) The histology section shows the cell density lymphatic sheaths, lymphoid follicles, marginal zone, red pulp and the total number of germinal centres (GC). Data are expressed as the mean ± SD, with 5 animals in each group. **p < 0.01 vs. normal; #p < 0.05, ##p < 0.01 vs. model.
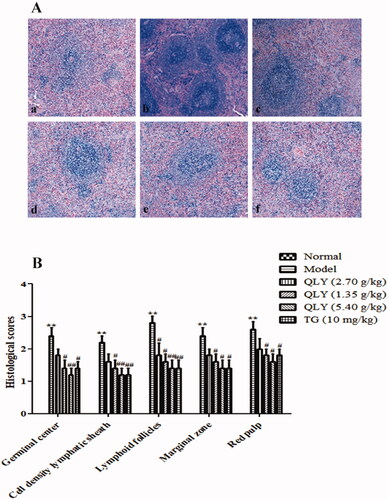
Figure 6. Effects of QLY granules on inflammatory cytokine production in serum. Data are expressed as the mean ± SD, with 10 animals in each group. **p < 0.01 vs. normal; #p < 0.05, ##p < 0.01 vs. model.
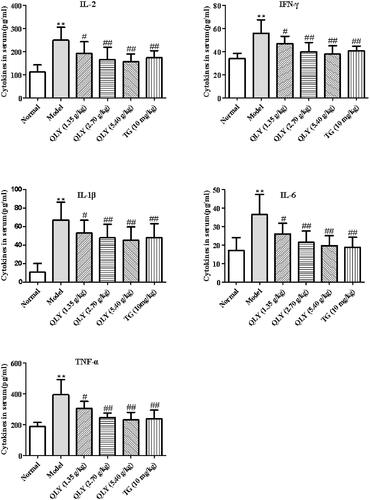
Figure 7. Effects of QLY granules on the expression of CXCL12/CXCR4 in spleen of AA rats. Expression of CXCL12 and CXCR4 level in spleen of AA rats. Representative immunohistochemical analyses of (A) CXCL12 and (B) CXCR4 expression in spleens, illustrating alterations in spleens of each group of rats (magnification, ×400). a: normal; b: model; c: QLY granules (1.35 g/kg); d: QLY granules (2.70 g/kg); e: QLY granules (5.40 g/kg); f: TG (10 mg/kg). Optical density value (ODV) of (C) CXCL12 and (D) CXCR4 in spleens markedly decreased in rats with AA following the administration of QLY granules and TG. Data are expressed as the mean ± SD, with 5 animals in each group. **p < 0.01 vs. normal, #p < 0.05 vs. model.
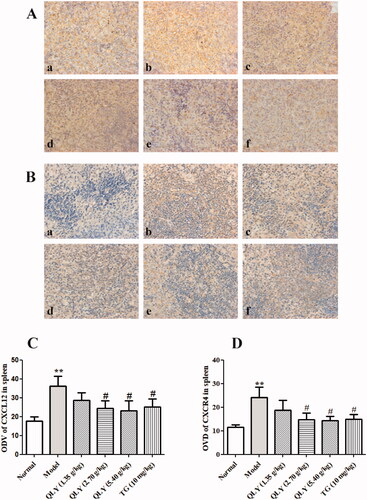
Figure 8. Effects of QLY granules on expression of CXCL12-mediated inflammatory signalling in AA rats. (A) Representative images of Western blotting of the expression of CXCL12, CXCR4, P65 and p-P65. a: normal; b: model; c: QLY granules (1.35 g/kg); d: QLY granules (2.70 g/kg); e: QLY granules (5.40 g/kg); f: TG (10 mg/kg). Western blotting semi-quantification of (B) CXCR4 and (C) CXCL12. (D) Ratio of p-P65 / total P65. Data are expressed as the mean ± SD, with 3 samples in each group. **p < 0.01 vs. normal, #p < 0.05, vs. model.
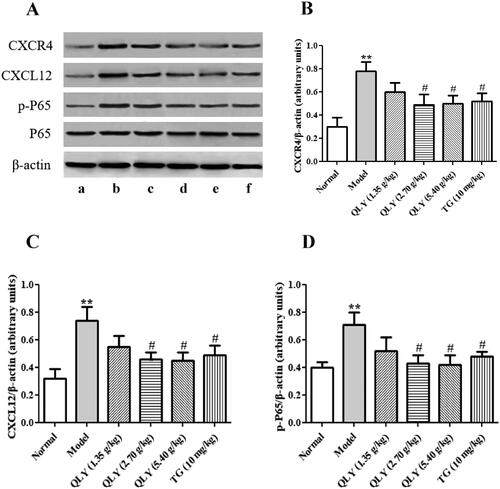
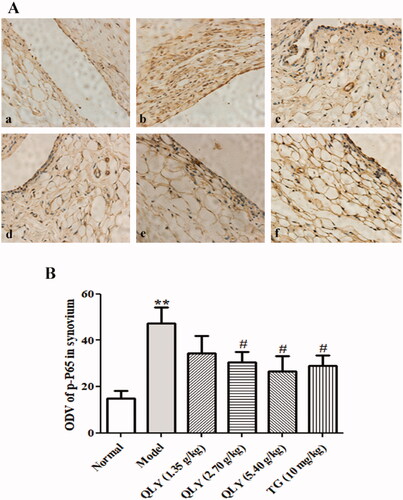
Figure 9. Effects of QLY granules on expression of p-P65 in synovial tissues. (A) Representative immunohistochemical analyses of p-P65 expression in the synovial tissues, illustrating alterations in the synovial tissues of each group of rats (magnification, ×400). a: normal; b: model; c: QLY granules (1.35 g/kg); d: QLY granules (2.70 g/kg); e: QLY granules (5.40 g/kg); f: TG (10 mg/kg). (B) ODVs of p-P65 in the synovial tissues markedly decreased in rats with AA following administration of QLY granules and TG. Data are expressed as the mean ± SD, with 3 samples in each group. **p < 0.01 vs. normal; #p < 0.05 vs. model.