Figures & data
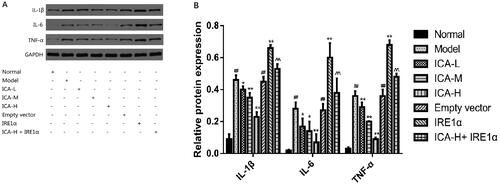
Figure 1. Primary microglia purity was identified by immunofluorescence. Blue signal indicates nuclear staining with DAPI; red signal represents CD11b staining with CY3; arrows represent microglia with typical morphology.
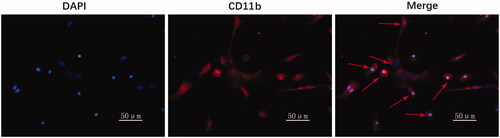
Figure 2. Transduction rate of lentiviral plasmid in microglia. Neonatal rat microglia were plated in six-well plates with complete medium 24 h prior infection. Next day, microglia were infected with IRE1 overexpressed lentivirus at different multiplicity of infection (MOI) value (10–80) and incubated for 12 h. Microglia were gathered 72 h after transfection, and transduction efficiency was measured with an inverted fluorescence microscopy (Olympus, Tokyo, Japan). Green signal represents infected cells. Transduction rate was approximately 90% at an MOI of 80. W: observation under white light; G: observation under green light.
Figure 3. ICA reduced the mRNA expression of IRE1α/XBP1 inflammatory signal axis induced by OGD/R. Microglia were subjected to 2 h of OGD followed by 24 h reoxygenation. ICA (0.37, 0.74 and 1.48 μmol/L) administration was performed 1 h prior OGD and maintained 2 h throughout OGD. IRE1α, XBP1u, XBP1s, NLRP3 and caspase-1 mRNA expression was assayed by qRT-PCR. Data are expressed as mean ± SD of three independent experiments. ##p< 0.01 vs. normal control group; *p< 0.05, **p< 0.01 vs. OGD/R group; ^^p< 0.01 vs. ICA-H group. ICA-L: 0.37 μmol/L ICA, ICA-M: 0.74 μmol/L ICA and ICA-H: 1.48 μmol/L ICA.
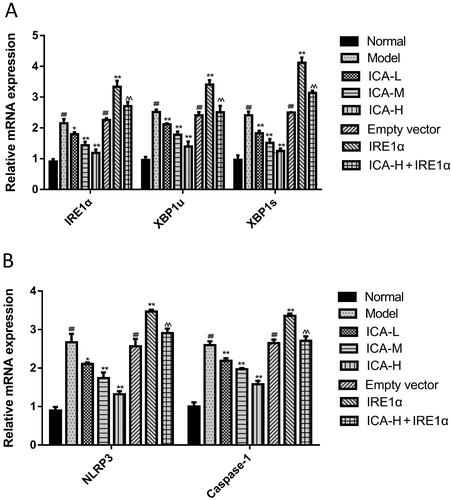
Figure 4. ICA suppressed the protein expression of IRE1α/XBP1 inflammatory signal axis induced by OGD/R. Microglia were suffered from 2 h of OGD followed by 24 h reoxygenation. ICA (0.37, 0.74 and 1.48 μmol/L) administration was performed 1 h before OGD and acting through 2 h OGD. IRE1α, p-IRE1α, XBP1u, XBP1s, NLRP3 and caspase-1 protein expression was examined by WB. Data are expressed as mean ± SD of three independent experiments. ##p< 0.01 vs. normal control group; *p< 0.05, **p< 0.01 vs. OGD/R group; ^^p< 0.01 vs. ICA-H group. ICA-L: 0.37 μmol/L ICA, ICA-M: 0.74 μmol/L ICA and ICA-H: 1.48 μmol/L ICA.
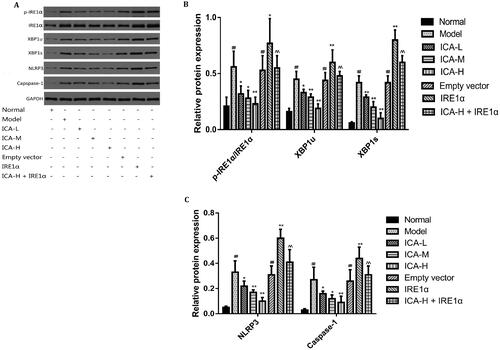
Figure 5. ICA inhibited the expression and release of IL-1β, IL-6 and TNF-α induced by OGD/R. Microglia were suffered to 2 h of OGD followed by 24 h reoxygenation. ICA administration was performed 1 h prior OGD and acting through 2 h OGD. IL-1β, IL-6 and TNF-α protein levels were measured by WB and ELISA. Data are expressed as mean ± SD of three independent experiments. ##p < 0.01 vs. normal control group. *p< 0.05, **p < 0.01 vs. OGD/R group. ^^p < 0.01 vs. ICA-H group. ICA-L: 0.37 μmol/L ICA, ICA-M: 0.74 μmol/L ICA and ICA-H: 1.48 μmol/L ICA.