Figures & data
Figure 1. Effects of mild hypoxia on the proliferation of BV-2 and PC-12 cells. (A) Schematic illustration of BV-2 and PC-12 cells induction of hypoxia protocol. (B, C) Effects of mild hypoxia on the proliferation of BV-2 cells (B) and PC-12 cells (C) with 5% O2. The cell viability was evaluated using a CCK-8 assay (n = 6). Data represent the mean ± SEM and are representative of triplicate experiments (one-way ANOVA).

Figure 2. Effects of mild hypoxia on the Hif-1α protein of BV-2 and PC-12 cells. Hif-1α protein expression was measured by Western blotting in BV-2 cells (A) and PC-12 cells (B) treated with 5% O2 for 1, 3, 5 and 24 h. β-actin served as a loading control. Data are shown as the mean ± SEM and are representative of triplicate experiments (one-way ANOVA).
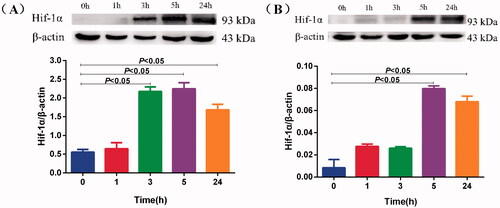
Figure 3. The predicted interactions between Hif-1α with salidroside, rhodiosin, tyrosol and p-hydroxybenzyl alcohol. (A, B) Salidroside, (C, D) rhodiosin, (E, F) tyrosol and (G, H) p-hydroxybenzyl alcohol.
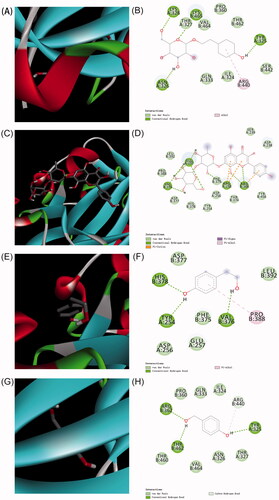
Table 1. Binding energy of between Hif-1α with salidroside, rhodiosin, tyrosol and p-hydroxybenzyl alcohol.
Figure 4. Salidroside blocked Hif-1α degradation in BV-2 and PC-12 cells. (A) Schematic illustration of BV-2 and PC-12 cells treatment protocol. (B, C) Hif-1α protein expression was measured by Western blotting in BV-2 cells (B) and PC-12 cells (C) treated with salidroside (Sal, 10 μM), rhodiosin (Rho, 10 μM), tyrosol (Tyr, 10 μM), p-hydroxybenzyl alcohol (Hyd, 10 μM) or deferoxamine (DFO, 100 μM) under normoxia (21% O2, 5% CO2) or mild hypoxia (5% O2, 5% CO2). β-actin served as a loading control. (D, E) Relative mRNA expression of Hif-1α in BV-2 cells (D) and PC-12 cells (E) treated with salidroside, rhodiosin, tyrosol, p-hydroxybenzyl alcohol or desferrioxamine under normoxia for 4 h. GAPDH was the housekeeping control. Data are shown as the mean ± SEM and are representative of triplicate experiments (one-way ANOVA).
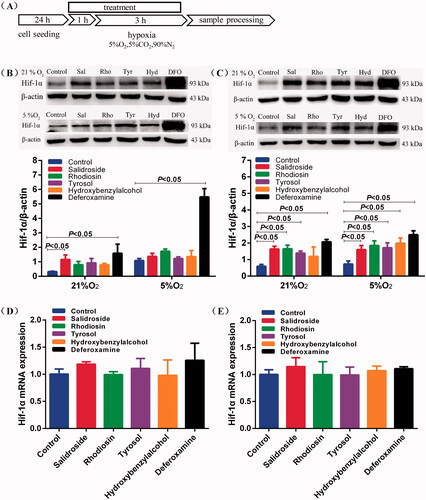
Figure 5. Salidroside increased the secretion of lactic acid in BV-2 and PC-12 cells. (A, B) Effects of different concentrations of salidroside on the proliferation of BV-2 cells (A) and PC-12 cells (B). The cell viability was evaluated using a CCK-8 assay (n = 6 per group). (C, D) The secretion of lactate in BV-2 cells (C) and PC-12 cells (D) treated with vehicle, salidroside (Sal, 1, 10 and 100 μM), or deferoxamine (DFO, 100 μM). The lactate release was evaluated using a Lactate Colorimetric Assay kit (n = 6 per group). Data are shown as the mean ± SEM and are representative of triplicate experiments (one-way ANOVA).
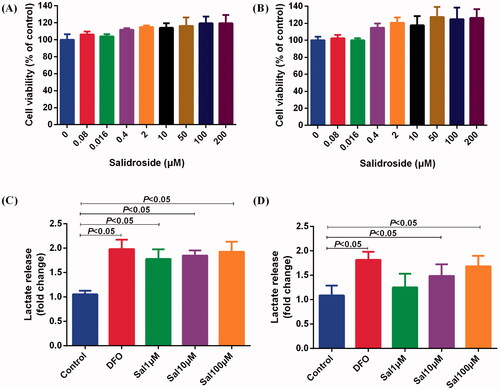
Figure 6. Salidroside induced metabolic reprogramming from oxidative phosphorylation to glycolysis in BV-2 and PC-12 cells. (A, B) Glycolysis determined by measuring ECAR in BV-2 cells (A) (n = 4 per group) and PC-12 cells (B) (n = 4 per group) treated with vehicle, salidroside (Sal, 1, 10 and 100 μM), or deferoxamine (DFO, 100 μM). (C, D) Oxidative phosphorylation determined by measuring OCR in BV-2 cells (C) (n = 4 per group) and in PC-12 cells (D) (n = 4 per group) treated with vehicle, salidroside (1, 10 and 100 μM), or DFO (100 μM). Data are shown as the mean ± SEM and are representative of triplicate experiments (one-way ANOVA).
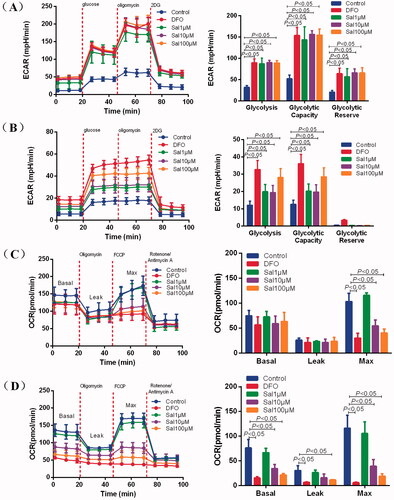
Figure 7. Salidroside induced glycolytic metabolism in mice. (A) Hif-1α protein expression was measured by Western blotting in mice after salidroside treatment (Sal, 25, 50 and 100 mg/kg). β-actin served as a loading control. (B) The secretion of lactate in the brain tissue of mice treated with vehicle, salidroside. The lactate release was evaluated using a Lactate Colorimetric Assay kit (n = 10 per group). Data are shown as the mean ± SEM and are representative of triplicate experiments (one-way ANOVA).
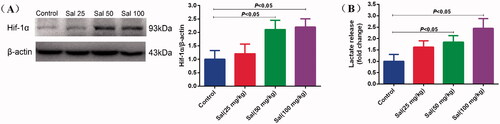
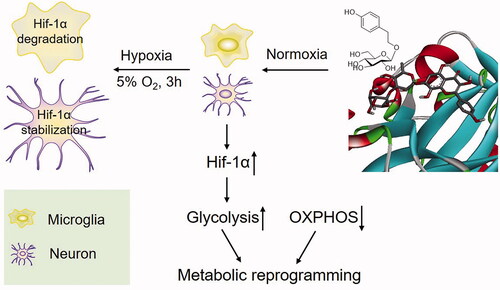
Figure 8. Proposed mechanism for the prevention of salidroside against AMS.