Figures & data
Table 1. Primer sets used for qRT-PCR.
Figure 1. Ultrastructural analysis. Transmission electron microscopy images of BM-vesicles (A) and BM-vesicles with SFN (B). Scale bar = 500 nm.
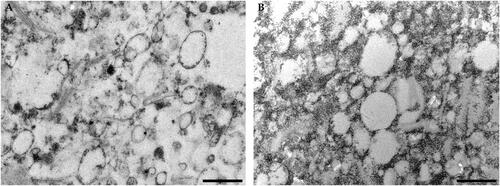
Figure 2. Dynamic light scattering analysis. Z-average (nm) (A), Polydispersity index (B), and Zeta potential (mV) (C) were measured in Broccoli membrane (BM)-vesicles and BM-vesicles with sulforaphane (SFN) at the initial time (T0) and 1 week after sample preparation (T1). Schematic representation of the significance of Zeta Potential values (D). Data are mean ± SE of three independent experiments.
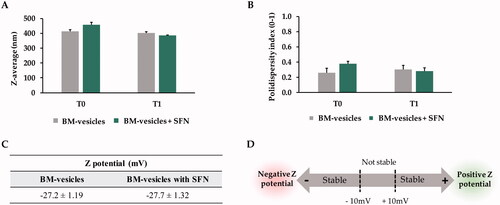
Figure 3. Stopped-flow analysis. Typical traces obtained from stopped-flow spectroscopy after hyperosmotic shock, the signals are shown are representative of ten traces obtained from Broccoli membrane (BM)-vesicles (A), and BM-vesicles with sulforaphane (SFN) (B). Water permeability coefficients (Pf) of BM-vesicles and BM-vesicles with SFN (C). Data are mean ± SE of three independent experiments with at least 10 traces.
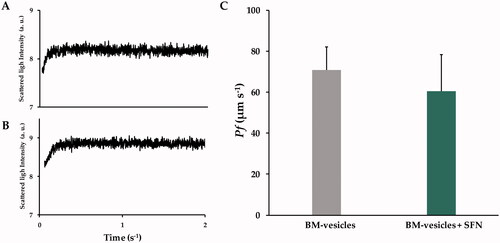
Figure 4. Proteomic analysis. The proteins found in the BM-vesicles were classified according to Molecular function (A), Biological process (B), and Subcellular location (C) according to Gene Ontology (The Gene Ontoly Consortium Citation2019). The protein data were obtained from the Uniprot database (www.uniprot.org) (Bateman Citation2019).
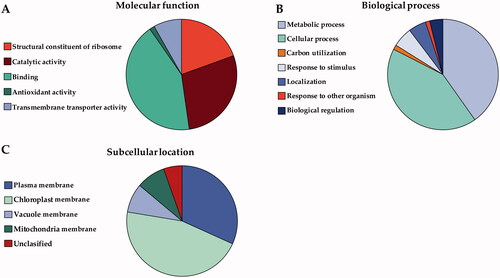
Figure 5. Cytotoxic effects. In the MTT assay, the cytotoxic effects in SK-MEL-28 cells of Broccoli membrane (BM)-vesicles at different concentrations (0.04–0.0003125%) (A) and free and encapsulated sulforaphane (SFN) (5, 25, and 100 µM) (B) were analyzed. Data are mean ± SE of three independent experiments. Different letters indicate significant differences between groups after one-way ANOVA and Duncan’s test (p < 0.05).
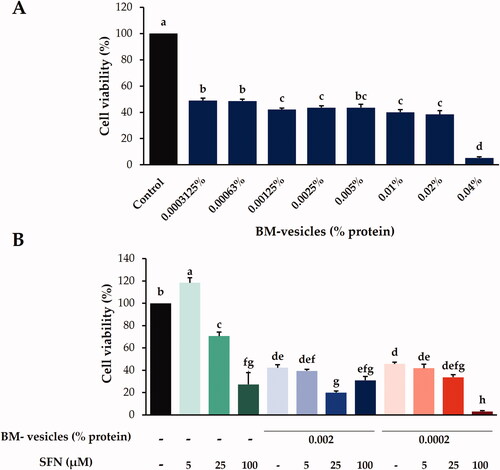
Figure 6. Morphological analysis. Phase-contrast microscopy images of SK-MEL-28 cells treated with different concentrations (% protein) of Broccoli membrane (BM)-vesicles. Scale bars = 200 µm.
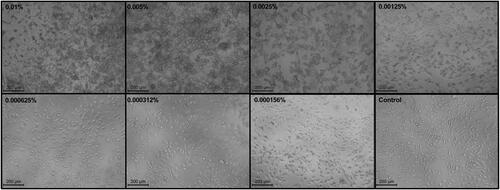
Figure 7. Morphological analysis. Phase-contrast microscopy images of SK-MEL-28 cells treated with different treatments: control, free sulforaphane (SFN) (5, 25, and 100 µM), Broccoli membrane-vesicles (BM-V) (0.002 and 0.0002% protein), and SFN (5, 25, and 100 µM) encapsulated in BM-vesicles (0.002 and 0.0002% protein). Scale bars = 200.
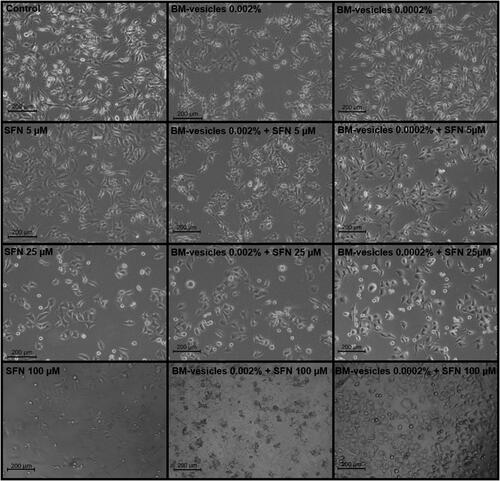
Figure 8. RT-qPCR analysis. Relative gene expression of TNFα (A), p53 (B), BAX (C), and AQP3 (D) in SK-MEL-28 cells after the application of Broccoli membrane (BM)-vesicles (0.0002%) and two concentrations of free or encapsulated sulforaphane (SFN) (5 and 25 µM) for 24 h. Data are mean ± SE (n = 3). Different letters indicate significant differences between groups after a one-way ANOVA and Duncan’s test (p < 0.05).
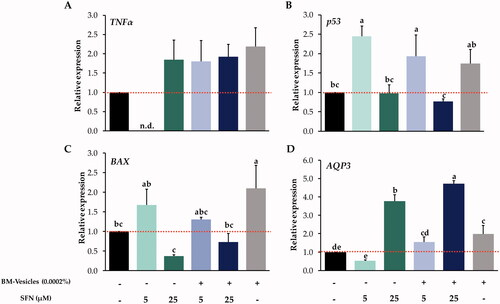
Figure 9. SFN metabolism analysis. Amount (ng) of sulforaphane (SFN) inside SK-MEL-28 cells (A), and their release into the culture medium (B) after the application of Broccoli membrane (BM)-vesicles (0.0002%) and two concentrations of free or encapsulated sulforaphane (SFN) (5 and 25 µM) for 24 h. Data are mean ± SE (n = 3). Different letters indicate significant differences between groups after a one-way ANOVA and Duncan’s test (p < 0.05).
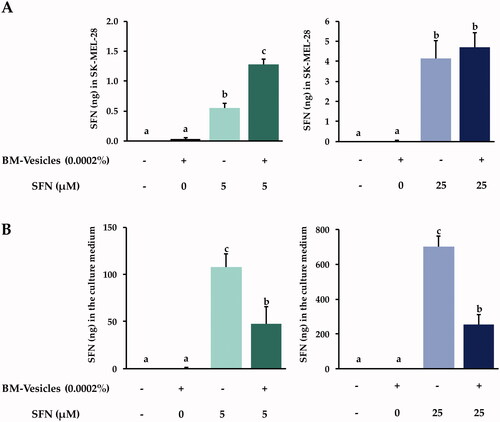
Table 2. Metabolite sulforaphane-cysteine (SFN-CYS) was measured in cell lysates in SK-MEL-28 cells after the application of the treatments for 24 h.
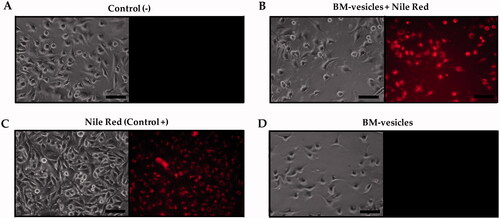
Figure 10. BM-vesicles penetration in cells. Phase-contrast microscopy and fluorescence microscopy from SK-MEL-28 culture (A) and after incubation with BM-vesicles labelled with Nile Red (NR) (B), with free NR (positive control) (C), and with BM-vesicles without NR (D). Scale bar = 100 mm.