
Figures & data
Table 1. RT-PCR primers and probes.
Figure 1. Vector map and sequencing results. (A) pLenti-P2A Vector. (B) pLenti-P2B Vector. (C) pHIV-lus-ZsGreen Vector. (D) Sequence alignment results.
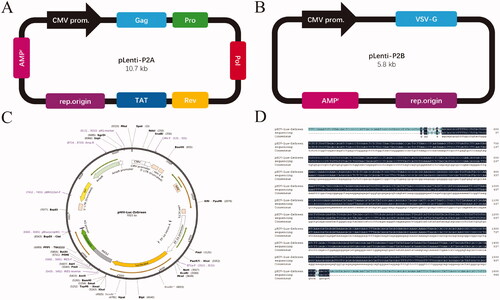
Figure 2. Plasmid transfection and viral packaging. (A,B) Transfection of plasmids into 293 T cells, (C,D) 786-O cells infected by packaged viruses.
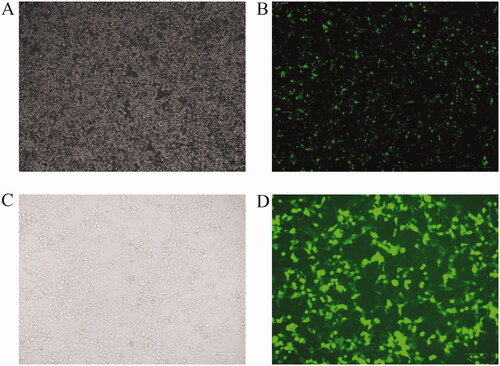
Figure 3. Screening results of eight Chinese medicinal compositions. (A) Effects of eight Chinese medicinal compositions on cell survival rates. (B) Effects of eight Chinese medicinal compositions on viral inhibition rates. 1: G. uralensis; 2: R. japonica; 3: N. cataria; 4: L. erythrorhizon; 5: S. flavescens; 6: C. cassia; 7: E. japonica; 8: Cortex Mori.
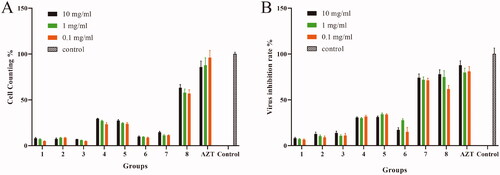
Figure 4. Effects of Cortex Mori on the expression of RT enzyme products at different stages. (A) Effects of Cortex Mori on the expression of total RT enzyme products. (B) Effects of Cortex Mori on the expression of late RT enzyme products. (C) Effects of Cortex Mori on the expression of integrated DNA enzyme products. CM group: DMSO, HIV, and Cortex Mori were added to the cells; AZT group: only AZT and DMSO were added to the cells; HIV group: only HIV and DMSO were added to the cells; DMSO group: only DMSO was added to the cells; control group: the cells did not receive any medicinal treatments. Data are expressed as the mean ± SEM. **p < 0.01, ***p < 0.001, ****p < 0.0001.
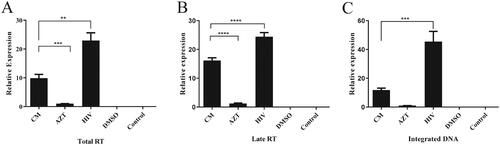
Figure 5. Chromatogram of liquid phase mass spectrum peaks for separation and identification of Cortex Mori granules.
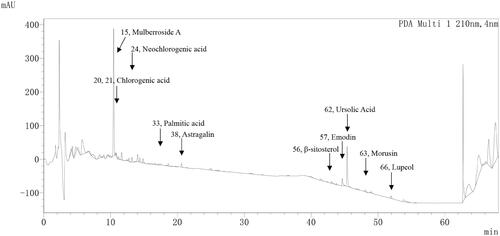
Table 2. Chromatographic peak parameters corresponding to the chromatograms of 10 Chinese medicine monomers contained in Mori Cortex.
Figure 6. Effects of five active monomer compounds in Cortex Mori on the expression of products at different stages of HIV infection. (A) Effects of five active monomer compounds in Cortex Mori on the expression of total RT enzyme products. (B) Effects of five active monomer compounds in Cortex Mori on the expression of late RT enzyme products. (C) Effects of five active monomer compounds in Cortex Mori on the expression of integrated DNA products. Data are expressed as the mean ± SEM. ***p < 0.001, ****p < 0.0001.
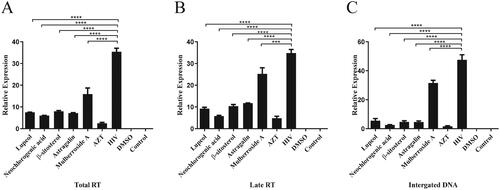
Figure 7. Analysis of the target of neochlorogenic acid. (A) GO enrichment analysis. (B) Pathway analysis. (C) PPI analysis.
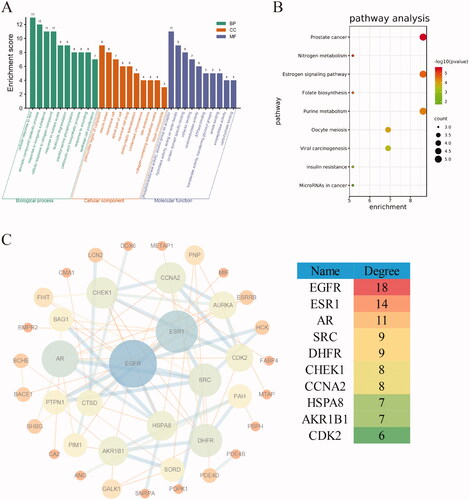
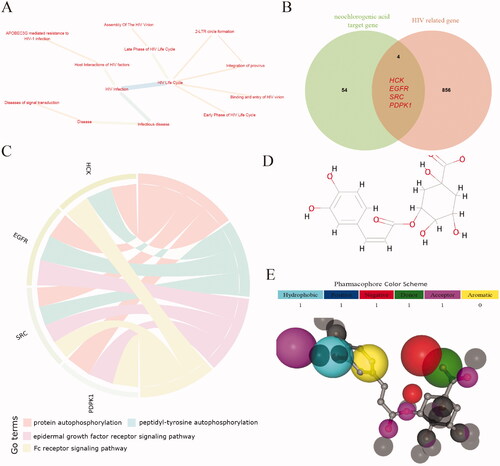
Figure 8. Target analysis of neochlorogenic acid acting on HIV. (A) HIV-related pathway. (B) The intersection of HIV-related genes and new chlorogenic acid targets. (C) Intersection gene enrichment results. (D) The structural formula of neochlorogenic acid. (E) Combination model of neochlorogenic acid and 1MU2.
Data availability statement
The relevant data have been uploaded as supplementary and can also be obtained from the corresponding author.