
Figures & data
Figure 1. Pathological examination of haematoxylin and eosin-stained organs (liver, spleen and kidney) from osteoporosis mice (200×) (Scale Bar: 50 μm) (n = 3). CTRL: control; Dex: dexamethasone; E2: oestradiol; AU: aucubin.
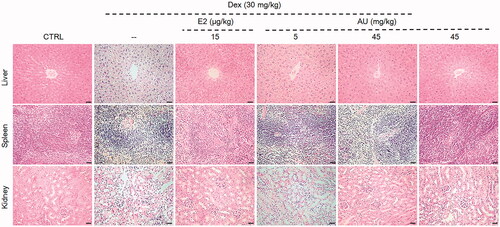
Table 1. Effects of AU on the body weight and organ indexes of OP mice.
Figure 2. Effects of AU on the femoral bone morphology and the concentrations of osteoporosis (OP)-related factors in OP mice. (A) Micro-computed tomography images of the femurs of OP mice. (B) Three-dimensionally reconstructed images of trabecular bone in the femurs of OP mice. (C) Analysis of OP parameters (BMD, BV/TV, BS/BV, Tb.Sp, Tb.Th and Tb.N). Data are expressed as the means ± SEMs (n = 6) and were analysed using a one-way ANOVA. #p < 0.05, ##p < 0.01 and ###p < 0.001 versus control mice; *p < 0.05, **p < 0.01 and ***p < 0.001 versus OP mice. CTRL: control; Dex: dexamethasone; E2: oestradiol; AU: aucubin.
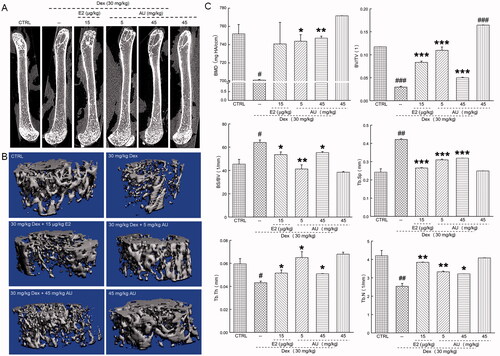
Figure 3. The effects of AU on the femoral histology of OP mice, as detected by (A) haematoxylin and eosin staining (40×) (Scale Bar: 200 μm) and (B) Giemsa staining (40×) (Scale Bar: 200 μm) (n = 6). CTRL: control; Dex: dexamethasone; E2: oestradiol; AU: aucubin.
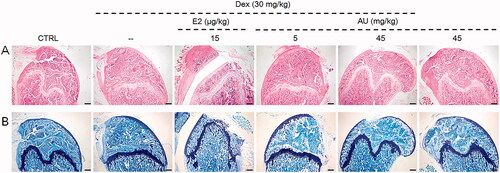
Figure 4. AU regulated the serum concentrations of (A) TRAP5b, (B) IL-1, (C) IL-6 and (D) P1NP in osteoporosis mice. Data are expressed as the means ± SEMs (n = 6) and were analysed using a one-way ANOVA. #p < 0.05 and ##p < 0.01 versus control mice; *p < 0.05 and **p < 0.01 versus OP mice. CTRL: control; Dex: dexamethasone; E2: oestradiol; AU: aucubin.
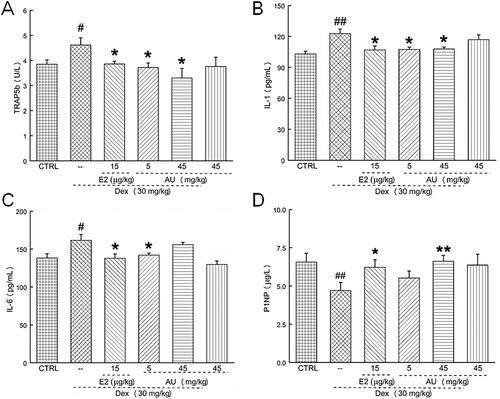
Figure 5. AU increased the concentration of osteogenic differentiation-related factors in the serum of osteoporosis mice. Thus, AU enhanced the serum concentrations of (A) BMP-2, (B) BGP, (C) BMPR-2 and (D) COL I. Data are expressed as the means ± SEMs (n = 6) and were analysed using a one-way ANOVA. #p < 0.05 and ##p < 0.01 versus control mice; *p < 0.05 and **p < 0.01 versus OP mice. CTRL: control; Dex: dexamethasone; E2: oestradiol; AU: aucubin.
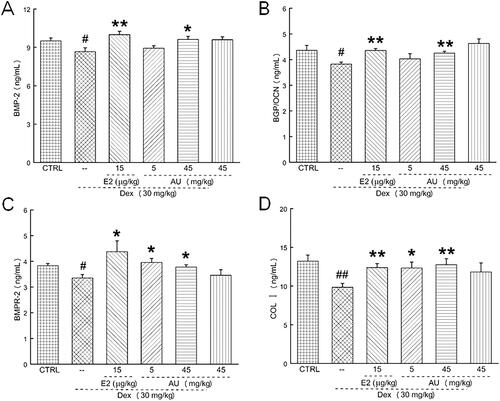
Figure 6. AU regulated the concentrations of oxidative stress-related factors in the serum of OP mice. AU decreased the concentrations of (A) ROS and increased the concentrations of (B) SOD and (C) CAT. Data are expressed as the means ± SEMs (n = 6) and were analysed using a one-way ANOVA. #p < 0.05 and ###p < 0.001 versus control mice; *p < 0.05, **p < 0.01 and ***p < 0.001 versus OP mice. CTRL: control; Dex: dexamethasone; E2: oestradiol; AU: aucubin.
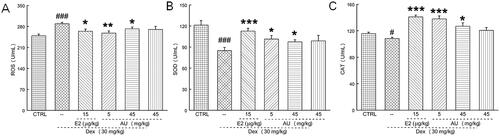
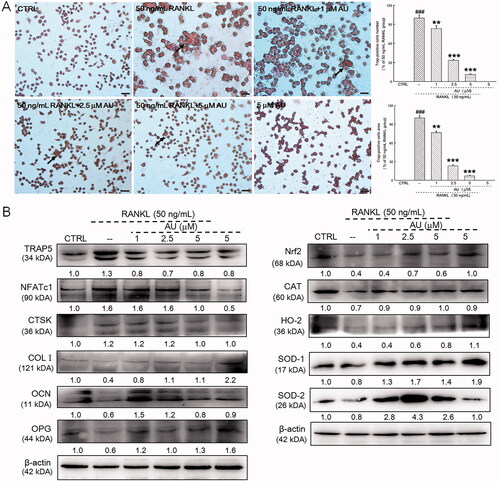
Figure 7. AU suppressed the receptor activator of nuclear factor-κB ligand (RANKL)-induced differentiation of RAW264.7 cells to osteoclasts. (A) AU decreased the percentage of numbers and area of TRAP-positive RANKL-exposed RAW264.7 cells (200×) (Scale Bar: 50 μm). Data are expressed as the means ± SEMs (n = 6) and were analysed using a one-way ANOVA. ###p < 0.001 versus control cells; **p < 0.01 and ***p < 0.001 versus RANKL-induced differentiated cells. (B) In RANKL-exposed RAW264.7 cells, AU increased the expression levels of COL I, OCN, OPG, Nrf2, CAT, HO-2, SOD-1 and SOD-2, and decreased the expression levels of TRAP5, NFATc1 and CTSK. The quantitative expression of each protein was normalised to β-actin and is presented as the fold-expression compared with the expression in control cells (n = 6). CTRL: control; AU: aucubin.
Supplemental Material
Download ()
Data availability statement
All data generated and analysed during the study are included in this published article.