Figures & data
Figure 1. GA-amide inhibited the proliferation and induced the apoptosis of HUVECs and NhECs. (A) GA-amide was evaluated for its effects on the cell viability of HUVECs and NhECs using the MTS assay. ECs were treated with GA-amide for 48 h, and the IC50 values were calculated by GraphPad Prism 9.0. (B,C) Flow cytometry-based quantification of HUVEC (B) and NhEC (C) apoptosis after 6 h of exposure to different concentrations of GA-amide by annexin V/PI staining. (D,E) Quantitative analysis of (B) and (C). Data are presented as the mean ± S.D., and samples were assayed in triplicate. Significant differences between individual groups were determined by one-way ANOVA. **p < 0.01; ***p < 0.001; ****p < 0.0001. (F,G) Western blotting was used to analyze the cleavage of cell apoptosis proteins (PARP and Caspase-3) in HUVECs and NhECs after treatment with GA-amide for 6 h.
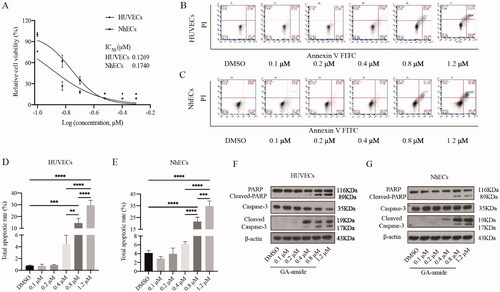
Figure 2. GA-amide inhibited the migration of HUVECs and NhECs. (A,B) Representative images showing scratch width after ECs were treated with 0.2 μM GA-amide for 0, 6, and 12 h. Images were taken under a phase-contrast microscope at 100× magnitude. Scale bar, 200 μm. (C,D) Quantitative analysis of (A) and (B). Data are presented as the mean ± S.D., and samples were assayed in triplicate. Significant differences between individual groups were determined using two-way RM ANOVA with Sidak’s multiple comparisons test. **p < 0.01; ***p < 0.001.
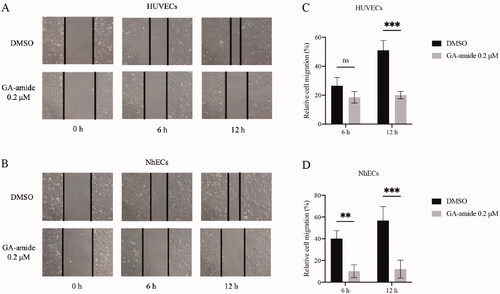
Figure 3. GA-amide inhibited angiogenesis both in vitro and in vivo and suppressed the expression of EC markers at both the mRNA and protein levels. (A) Representative images showing the tube formation by HUVECs treated with 0.2 μM GA-amide for 6 h. (B) Quantitative analysis of A after images were analyzed by ImageJ software. Scale bar, 200 μm. (C) Representative images showing tube formation by NhECs treated with 0.2 μM GA-amide for 6 h. (D) Quantitative analysis of C after images were analyzed by the ImageJ software. Scale bar, 200 μm. (E) Representative images showing the antiangiogenic effects of GA-amide (18.8 and 62.8 ng) and bevacizumab (Bev, 40 μg) on vessel sprouting and branching. (F) The graphs summarize the data for large vessels, small vessels, and capillaries from the CAM assay. Bev: Positive control. (G,H) The mRNA expression levels of EC markers in HUVECs (G) and NhECs (H) treated with GA-amide were evaluated by qRT–PCR. Data are presented as the mean ± S.D. of three independent determinations. *p < 0.05 and **p < 0.01 compared with DMSO by two-tailed Student’s t-test. (I,J) The protein expression levels of EC markers in HUVECs (I) and NhECs (J) treated with GA-amide were evaluated by Western blot.
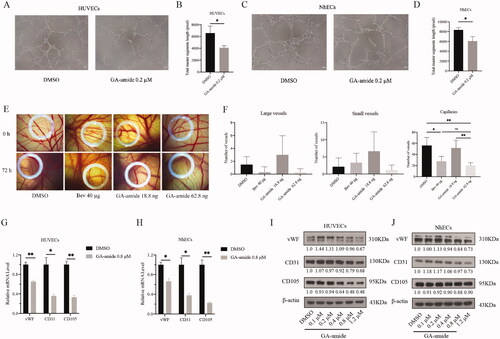
Figure 4. TrkA knockdown did not reverse the antiangiogenic effects of GA-amide on HUVECs and NhECs. (A) p-TrkA levels in HUVECs and NhECs after treatment with 0.2 μM GA-amide for 6 h were evaluated by Western blot. (B) TrkA and p-TrkA expression levels in HUVECs and NhECs after treatment with siTrkA were evaluated by Western blot. (C) Representative images showing the antiangiogenic effects of GA-amide on TrkA knockdown HUVECs. (D) Quantitative analysis of C. (E) Representative images showing the antiangiogenic effects of GA-amide on TrkA-knockdown NhECs. (F) Quantitative analysis of (E). (G) Representative images showing the antiangiogenic effects of GA-amide on normal and TrkA-knockdown HUVEC. (H) Quantitative analysis of (G). (I) Representative images showing the antiangiogenic effects of GA-amide on normal and TrkA knockdown NhECs. (J) Quantitative analysis of (I). Images were taken under a phase-contrast microscope at 100× magnitude. Images were analyzed by the ImageJ software, and the numbers of capillary-like structures in five separated fields of one well was calculated. Scale bar, 200 μm. Data are presented as the mean ± S.D. of three independent determinations. **p < 0.01 compared with the DMSO by two-tailed Student’s t-test.
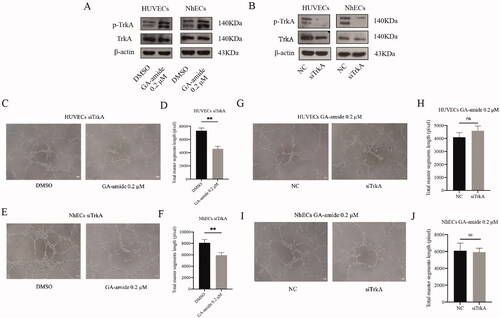
Figure 5. The inhibition of TrkA could not reverse the antiangiogenic effects of GA-amide on HUVECs and NhECs. (A) The inhibitory effects of GW441756 (TrkA inhibitor) on TrkA in HUVECs and NhECs were evaluated by Western blot. (B,C) Representative images showing the antiangiogenic effects of GA-amide with or without GW441756 on HUVECs (B) and NhECs (C). (D,E) Quantitative analysis of (B) and (C). Images were analyzed by ImageJ software, and the numbers of capillary-like structures in five separated fields of one well was calculated. Scale bar, 200 μm. Data are presented as the means ± S.D. of three independent determinations. *p < 0.05, **p < 0.01 and ***p < 0.001 compared with DMSO by two-tailed Student’s t-test.
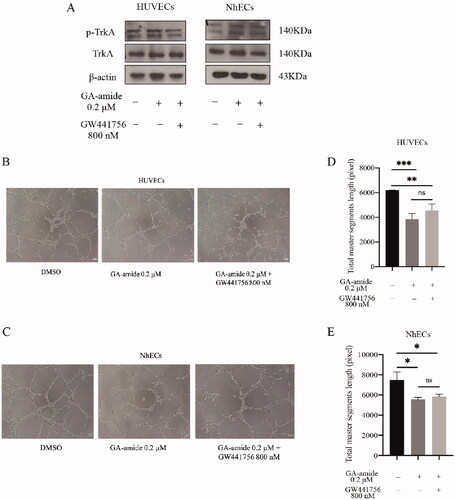
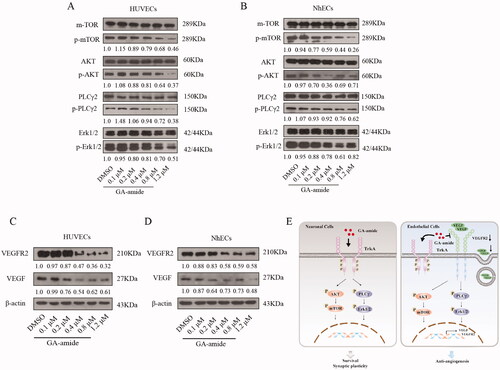
Figure 6. GA-amide suppressed the expression of VEGF and VEGFR2 and downregulated the activation of the AKT/mTOR and PLCγ/Erk1/2 pathways. (A,B) The expression levels of proteins involved in the AKT/mTOR and PLCγ/Erk1/2 pathways in GA-amide- or DMSO-treated HUVECs (A) and NhECs (B) were evaluated by Western blot. Quantitative analysis of phosphorylated protein levels normalized to non-phosphorylated protein levels in the corresponding samples. (C,D) The expression levels of VEGF and VEGFR2 in GA-amide- or DMSO-treated HUVECs (C) and NhECs (D) were evaluated by Western blot. (E) A model of the mechanism by which GA-amide inhibits angiogenesis by ECs.