Figures & data
Figure 1. Identification of the active compounds, gene targets, and signalling pathways of XYS. (A) Venn analysis of differentially expressed genes (DEGs) in the XYS, LDSDS, and liver fibrosis groups. (B) Heatmap of DEGs between chronic hepatitis B patients with or without LDSDS (n = 16 in each group). (C) The KEGG pathway analysis directly related to XYS. (D) The XYS-LDSDS-liver fibrosis core network analysis. Green, herbs; orange, compounds; indigo, target proteins directly related to XYS; purple, predicted target proteins directly related to XYS; dark blue, target proteins indirectly related to XYS; light blue, target proteins intermediately related to XYS; dark green, predicted target proteins intermediately related to XYS; deep red, core pathway; pink, noncore pathway.
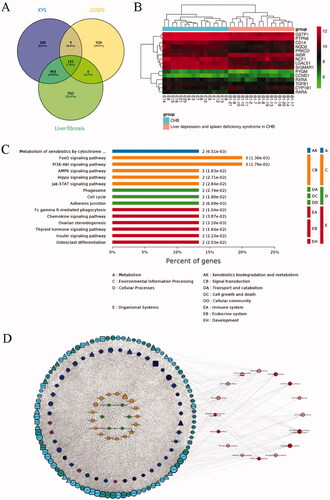
Figure 2. Contribution score analysis of the XYS-LDSDS-liver fibrosis core network. (A) Network centralisation (NC), characteristic path length (CPL), network heterogeneity (NH), and robustness (R) scores of the 17 compounds by using the entropy and the weighted summation methods, which were directly related to the network stability using Cytoscape 3.2.1 software. (B) Analysis of the contribution scores of the 17 compounds by combinations of the NC, CPL, NH and R parameters.
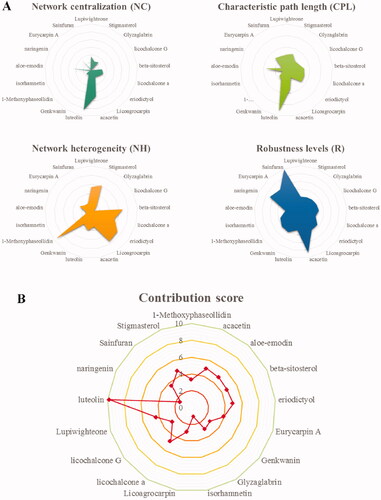
Table 1. Contribution scores of the compound combinations.
Figure 3. Effects of six individual XYS compounds and their combinations on regulating cell viability. (A) Cell viability assay. The four top compound combinations from network analysis show the effect on the LX2 cells. (B) Cell viability assay. The four top compound combinations from network analysis show the effect on the HSC-T6 cells. *p < 0.05 and **p < 0.01, compared to the control cells. (C) The most active compound combination LLAAF effect on the LX2 and HSC-T6 cells viability.
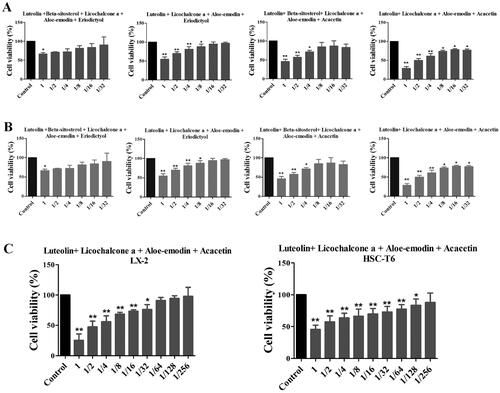
Figure 4. Effect of LLAAF on regulating protein expression in vitro. (A) Western blot analysis of α-SMA and collagen I expression in LX2 cells with treated with a high, medium, or low dose of LLAAF. Quantified data of the western blots are shown in the corresponding graphs. (B) Western blot analysis of α-SMA and collagen I expression in LX2 cells with treated with a medium dose of LLAAF or its individual compounds. (C) Western blot analysis of α-SMA and collagen I expression in HSC-T6 cells with treated with a high, medium, or low dose of LLAAF. Quantified data of the western blots are shown in the corresponding graphs. (D) Western blot analysis of α-SMA and collagen I expression in HSC-T6 cells with treated with a medium dose of LLAAF or its individual compounds. Quantified data of the western blots are shown in the corresponding graphs. #p < 0.05 and ##p < 0.01, compared to the control cells; *p < 0.05 and **p < 0.01, compared to the TGFβ group.
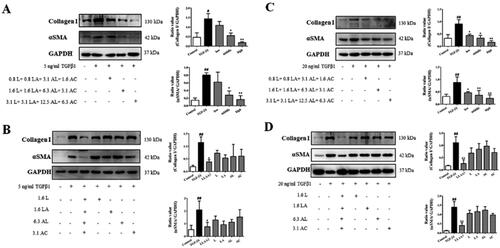
Figure 5. Effects of XYS-M and LLAAF treatment on the reduction in rat liver fibrosis. (A) H&E staining (200× magnification). (B) Masson’s staining (100×). (C) Semi-quantitative analysis of the collagen fibres. (D) The hydroxyproline (Hyp) content. (E) The levels of alpha-smooth muscle actin (α-SMA) and collagen I were analysed using western blot of rat liver fibrotic tissues. ##p < 0.01, compared to the control group; *p < 0.05, **p < 0.01, compared to the model group.
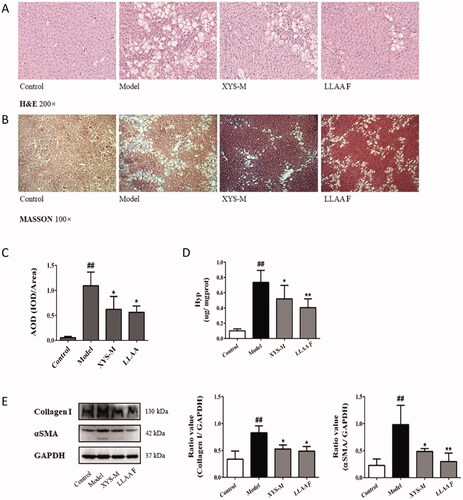
Figure 6. Bioinformatics analysis of the XYS- and LLAAF-modified PPI networks. (A) XYS network. (B) LLAAF network. (C) KEGG enrichment analysis of the XYS network. (D) KEGG enrichment analysis of the LLAAF network. (E) KEGG Pathway analysis compared with XYS and LLAAF.
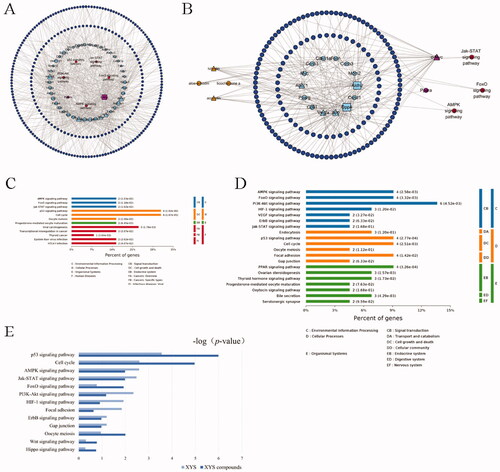
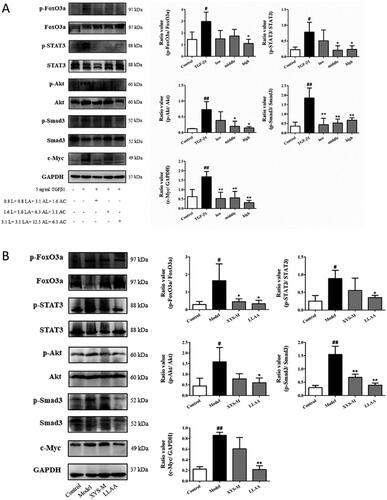
Figure 7. Effect of LLAAF treatment on the regulation of Jak-STAT and PI3K-Akt-FoxO signalling. (A) Western blot analysis of protein expression in LX2 cells were grown, treated with TGF-β1 and LLAAF. (B) Western blot analysis of protein expression in liver tissues. Quantified data of the western blots are shown in the corresponding graphs. #p < 0.05 and ##p < 0.01, compared to the cell control or rat control group; *p < 0.05 and **p < 0.01, compared to TGF-β1 or the CCl4 model group.