Figures & data
Figure 1. Study workflow.
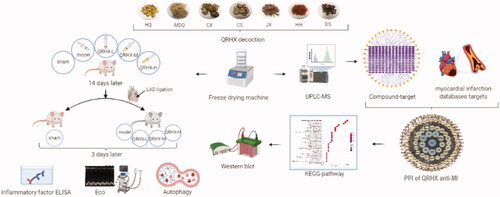
Table 1. Sequences of primers used for real-time PCR.
Figure 2. Total ion chromatograms of QRHX analysed by UPLC-MS. (A) Positive ion mode; (B) Negative ion mode.
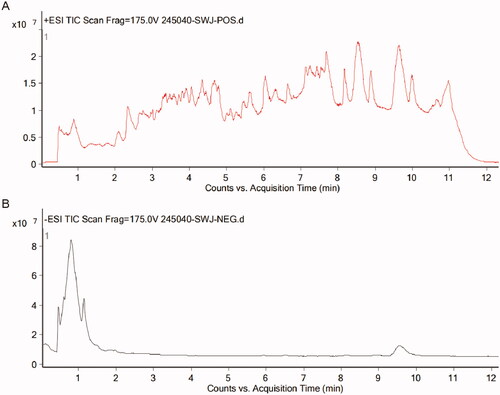
Table 2. The QRHX freeze-dry powder qualitative analysis results.
Figure 3. Compound-target network for QRHX. The purple rectangles represent targets; the orange triangle represent QRHX compounds.

Figure 4. Network pharmacology of QRHX against MI. (A) Venn diagram of QRHX and MI- related targets. (B) PPI network of QRHX in MI treatment.
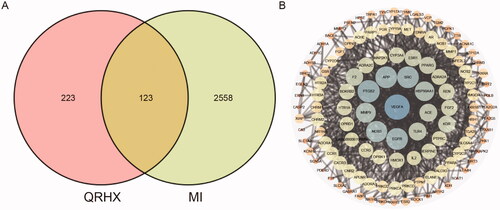
Figure 5. Target-pathway network for QRHX in MI treatment.
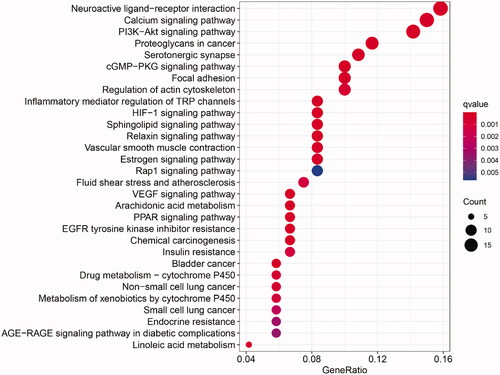
Figure 6. QRHX improves cardiac function and reduces the fibrosis area in MI rats. (A) H&E staining, (B) Sirius red staining, (C) Masson staining of heart tissue. (D) Area of fibrosis in each group. (E) LVEF and LVFS levels of rats in each group. (F) Myocardial infarction marker level of cTnl. Data were expressed as mean ± SEM. **p < 0.01 vs. Normal group, #p < 0.05 and ##p < 0.01 vs. Model group.
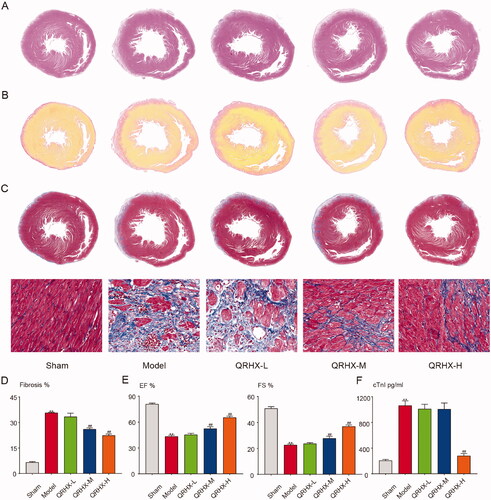
Figure 7. QRHX inhibits PI3K/Akt signal pathway and down-regulates the level of inflammatory cytokines. (A) Inflammatory factor levels of MCP-1, IL-17A, TNF-α and IL-1β. (B) Protein expression levels of p-PI3K, PI3K, p-Akt and Akt. (C) Quantitative analysis of p-PI3K, PI3K, p-Akt and Akt using ImageJ software. Data were expressed as mean ± SEM. **p < 0.01 vs. Normal group, #p < 0.05 and ##p < 0.01 vs. Model group.
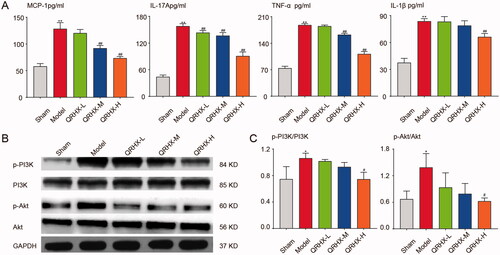
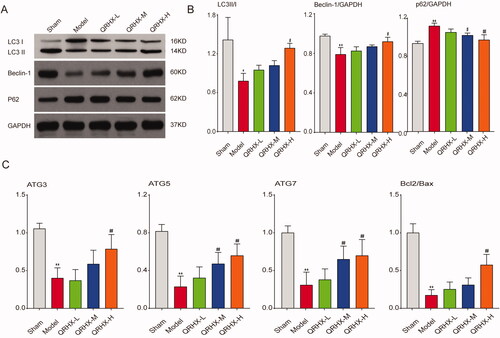
Figure 8. QRHX activated autophagy to exert myocardial protective function. (A) Protein expression levels of LC3B, Beclin-1, p62. (B) Quantitative analysis of LC3B, Beclin-1, p62 using ImageJ software. (C) mRNA expression levels of ATG3, ATG5, ATG7, Bcl2/Bax. Data were expressed as mean ± SEM. **p < 0.01 vs. Normal group, #p < 0.05 and ##p < 0.01 vs. Model group.