
Figures & data
Table 1. MS/MS settings for compound-dependent parameters for metformin and internal standard isoniazid.
Figure 1. Experimental in vitro drug release profile from free-drug and MET-loaded nanoparticles; respective mathematical modelling adjustment of data using: B) first-order model; C) Bhaskar model; D) modified Freundlich model; and E) Parabolic model. Notes: Notes: The samples can be identified as follows: (![]()
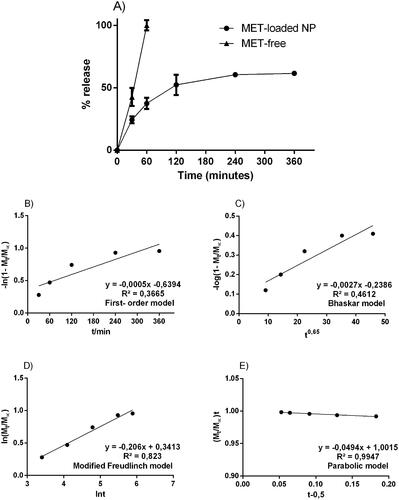
Figure 2. Residual plots for metformin.
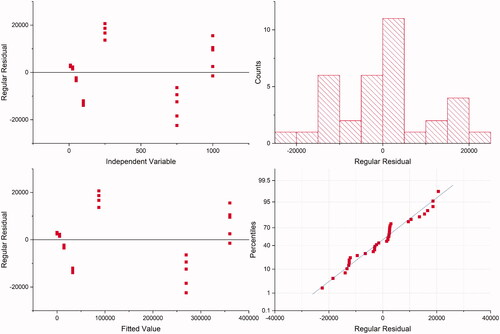
Table 2. Linear regression data.
Figure 3. Chromatograms from selectivity study. Blank plasma chromatograms in purple, blue, red and green; blank hemolyzed plasma chromatogram in pink; blank lipemic plasma chromatogram in orange; PLGA + plasma in yellow; metformin 250 ug mL−1 in black (m/z 130.1 → m/z 60.1) and isoniazide 1000 ng mL−1 in grey (m/z 138.1 → m/z 121.1).
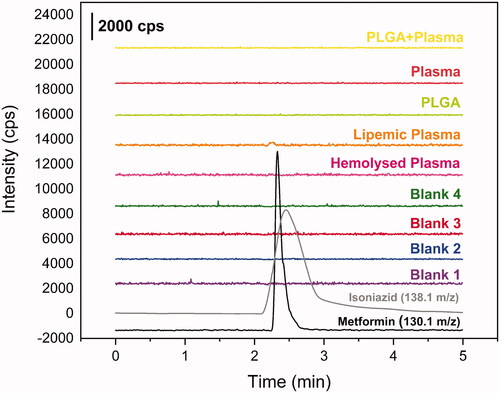
Table 3. Concentration of standards used for the calibration curve.
Figure 4. Bioavailability of metformin in single dose administration of metformin in saline and in formulation by oral gavage. Red: Met 100 mg + kg (metformin 100 mg/kg in saline solution, n = 4). Black: PLGA + MET 10 mg/kg (metformin 10 mg/kg in formulation containing PLGA, n = 4) in black.
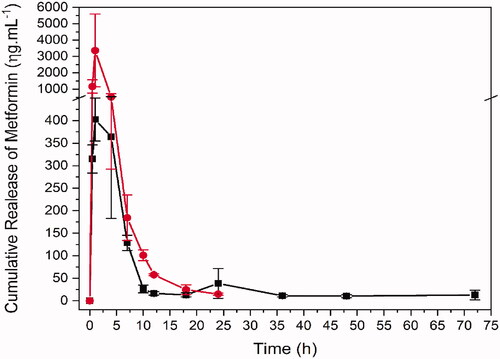
Table 4. Matrix effect results.
Table 5. Parameters estimates of MET pharmacokinetics with noncompartmental model in rat plasma by PKanalix version 2019R2 for PLGA + MET 10 mg kg−1 (metformin 10 mg kg−1 in formulation containing PLGA, n = 4) and MET 100 mg kg−1 (metformin 100 mg Kg−1 in saline solution, n = 4).