
Figures & data
Figure 1. The chemical structure of selexipag (A), its active metabolite ACT-333679 (B), and quercetin (C).
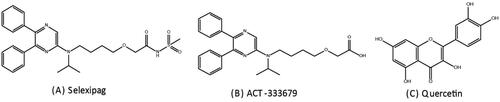
Figure 2. The product-ion mass spectrum of the analytes in the present study: (A) Selexipag; (B) ACT-333679; (C) Marimastat (IS).
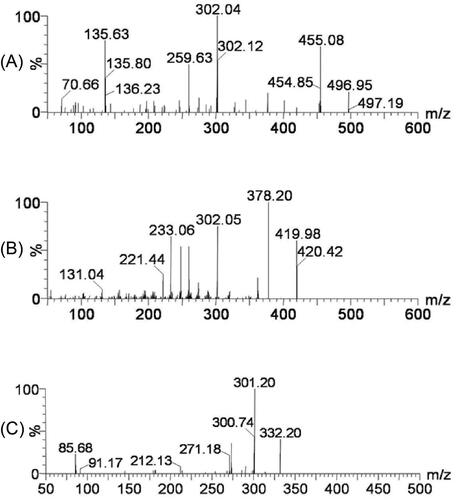
Figure 3. The representative chromatograms of the analytes in the present study: (A) a blank plasma sample; (B) a blank plasma sample spiked with selexipag, ACT-333679, and Marimastat (IS); (C) a beagle plasma sample after oral administration of selexipag.
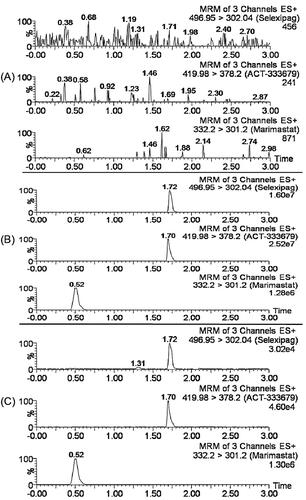
Table 1. Intra- and Inter-day accuracy and precision of selexipag and ACT-333679 in beagle plasma (n = 6, RSD%, RE%).
Table 2. The recoveries and matrix effect of selexipag and ACT-333679 in beagle plasma (n = 6, mean ± SD, RSD).
Table 3. Stability results of selexipag and ACT-333679 in beagle plasma in different conditions (n = 6, RSD%, RE%).
Figure 4. Mean plasma concentration-time profiles of selexipag (A) and ACT-333679 (B) in beagle dogs after orally administered selexipag (2 mg/kg) with and without quercetin pre-treatment (n = 6, Mean ± SD).
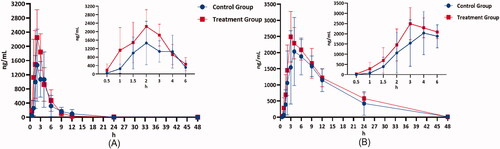
Figure 5. The semi-log transformed mean plasma concentration-time profiles of selexipag (A) and ACT-333679 (B) in beagle dogs after orally administered selexipag (2 mg/kg) with and without quercetin pre-treatment (n = 6, Mean ± SD).
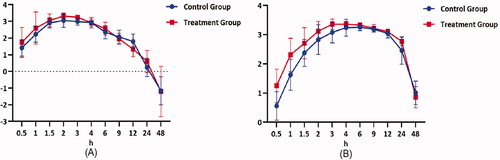
Table 4. The pharmacokinetic parameters of selexipag and ACT-333679 in beagle plasma after oral administration 2.0 mg/kg selexipag with or without treatment of quercetin (n = 6, Mean ± SD).