Figures & data
Figure 1. Effects of Con A on angiogenic activity in HUVECs and EA.hy926 cells. Images of Matrigel tube formation of Con A (0.3, 1, 3 μg/mL, 6 h)-treated HUVECs (A) and EA.hy926 cells (F), and analysis of total master segments length in HUVECs (B) or EA.hy 926 (G) (n = 6). ELISA assay showed the concentrations of VEGFa, PDGFaa, and bFGF, respectively, in the supernatant of HUVECs (C, D, E) and EA.hy926 (H, I, J) (n = 5) (*p < 0.05, **p < 0.01 vs. vehicle).
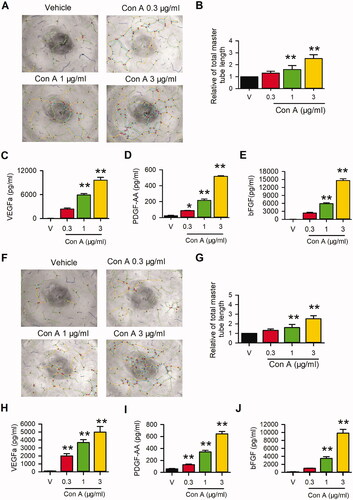
Figure 2. Effects of Con A on cell proliferation in HUVECs and EA.hy926 cells. Relative of cell viability in HUVECs (A) and EA.hy926 cell (B) treated with vehicle (PBS) or Con A (0.1, 0.3, 1, 3 μg/mL) using MTT assay. Immunofluorescent staining graphs of EdU in HUVECs (C) or Ea.hy926 cells (D) treated with vehicle (PBS) or Con A (0.3, 1, 3 μg/mL). Percentage values of EdU positive nuclei in HUVECs (E) or EA.hy926 cells (F) treated with vehicle (PBS) or different concentrations of Con A (0.1, 0.3, 1, 3 μg/mL). Flow cytometry graphs showing the distribution of cell cycle phases treated with vehicle or Con A (0.3, 1, 3 μg/mL) in HUVECs (G) or EA.hy926 cells (H). Percentage values of cell cycling population at different phases in HUVECs (I) or EA.hy926 cells (J) treated with Con A (0.1, 0.3, 1, 3 μg/mL) for 24 h (n = 5, *p <0.05, **p <0.01 vs. vehicle).
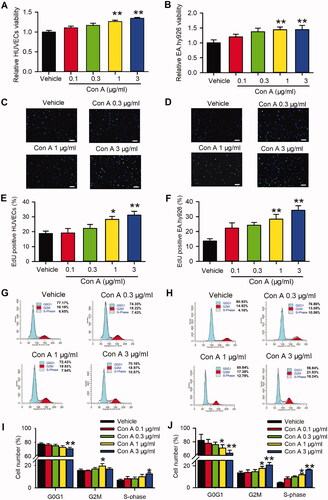
Figure 3. Improvement of blood flow and limb functions on ischaemia hindlimb in the treatment with Con A. (A). Representative laser Doppler flow imaging showed dynamic changes in blood perfusion in limb ischaemia at days 0 and 7. (B). The blood perfusion with the region of interest (ROI) value was tested by laser Doppler flow in three groups (n = 6, *p <0.05, **p <0.01 vs. vehicle).
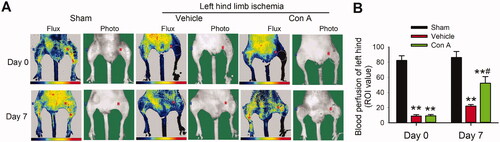
Figure 4. Molecular signals in Con A-regulated proliferation and angiogenesis in HUVECs. (A). Representative images of Western blot of pAkt (Ser473), Akt, pERK1/2, ERK1/2, pP38, and P38 in HUVECs treated with Con A. (B). Relative pAkt, pERK1/2, and pP38 expression in HUVECs treated with Con A (n = 5). (C). Represent images of western blot of cyclin D1, cyclin E, P27, and P21 in HUVECs treated with Con A. (D). Relative values of cyclin D1, cyclin E, P27, and P21 in HUVECs treated with Con A (n = 5, *p < 0.05, **p < 0.01 vs. vehicle).
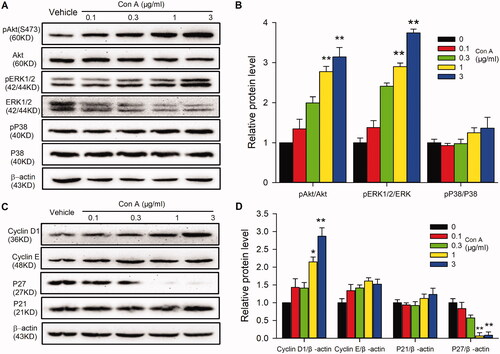
Figure 5. Effects of antagonists of the signal pathway on Con A-induced cell proliferation in HUVECs. (A). Relative of cell viability in HUVECs treated with vehicle (PBS), Con A (3 μg/mL), or Con A (3 μg/mL) plus with PI3K blocker LY294002 (10 μM) or MEK inhibitor PD98059 (10 μM) determined with MTT assay. Representative images (B) and Percentage values (C) of immunofluorescent staining of EdU in HUVECs treated with vehicle (PBS), Con A (3 μg/mL), or Con A (3 μg/mL) plus with LY294002 (10 μM) or PD98059 (10 μM). Representative images (D) and Percentage values (E) of flow cytometry graphs showing the distribution of cell cycle phases treated with vehicle (PBS), Con A (3 μg/mL), or Con A (3 μg/mL) plus with LY294002 (10 μM) or PD98059 (10 μM) (n = 6, *p <0.05, **p <0.01 vs. vehicle; #p <0.05, ##p <0.01 vs. Con A).
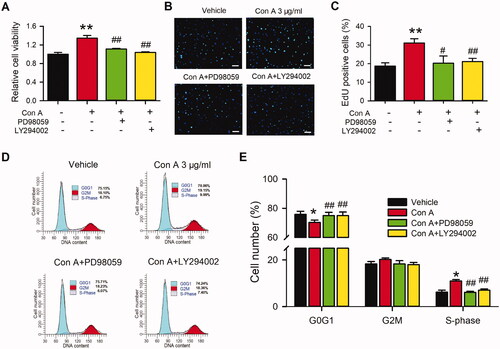
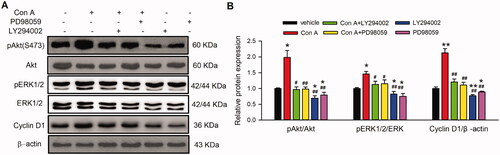
Figure 6. Effect of PI3K and MEK on Con A-induced cell proliferation-related molecular signal pathway. Images (A) and relative values (B) of western blots of pAkt (Ser473), Akt, pERK1/2, ERK1/2, cyclin D1 in cells treated with Con A (3 μg/mL) or Con A (3 μg/mL) plus with LY294002 (10 μM) or PD98059 (10 μM) (n = 5, *p <0.05, **p <0.01 vs. vehicle; #p <0.05, ##p <0.01 vs. Con A).