Figures & data
Figure 1. The work flow to elucidate the mechanism of SHD.
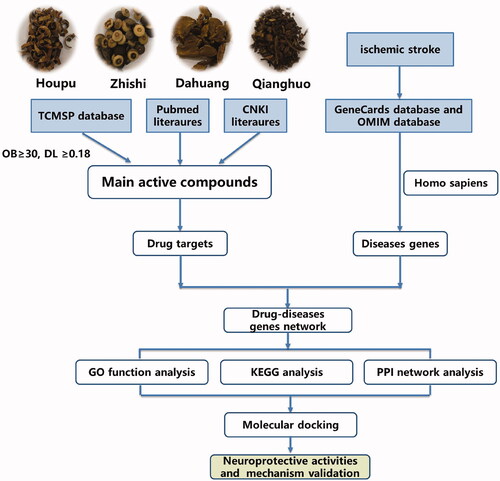
Table 1. The active compounds among the SHD for network analysis.
Figure 2. The compound-target network of SHD and analysis. The orange rectangles represent the potential targets, the green circles represent the compounds, the red diamonds represent the herbs and the purple hexagon represents SHD.
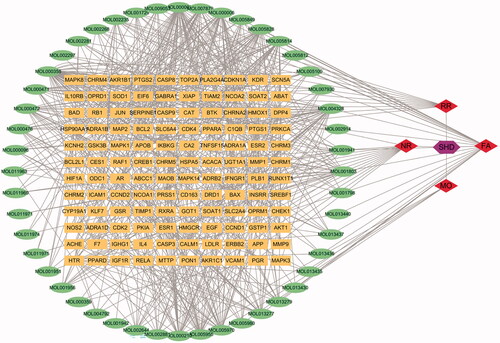
Figure 3. Venn diagram and disease-compound-target network of SHD. (A) The intersection of the potential SHD and ischaemic stroke targets. (B) Network of the targets shared between SHD and ischaemic stroke. The orange rectangles represent the potential targets, the green circles represent the compounds and the red diamonds represent the herbs.
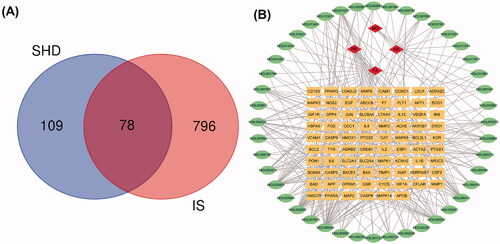
Table 2. The potential target genes associated compounds.
Figure 4. PPI networks of SHD treatment ischaemic stroke. (A) The network nodes represent proteins; the edge means line thickness indicates the strength of evidence. (B) Top 20 hub genes in the PPI network.
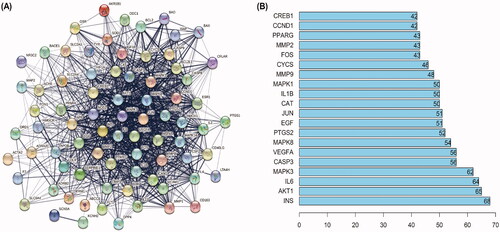
Figure 5. KEGG pathway and GO analysis using the DAVID database. (A) GO enrichment analysis. The red, green and blue colours represent biological process (BP), cellular component (CC) and molecular function (MF). (B) The chart of KEGG pathway enrichment.
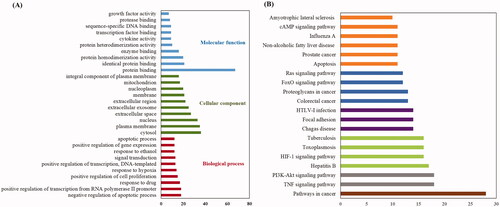
Figure 6. Molecular docking diagrams (3D and 2D). (A) Naringenin with Akt, (B) luteolin with Akt, (C) apigenin with Akt, (D) SC79 with Akt, (E) luteolin with IL6 and (F) apigenin with INS.
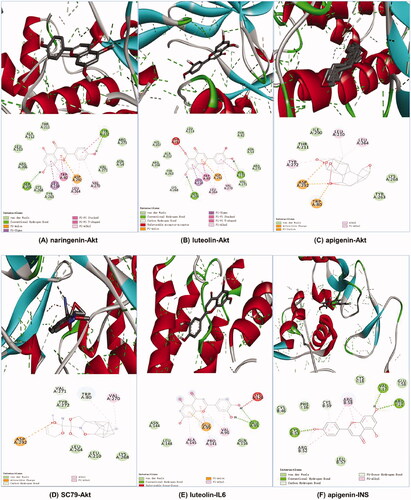
Table 3. Binding energy values of the key ingredient in SHD with Akt, INS and IL6.
Figure 7. Protective effect of SHD against OGD/R injury. (A) The effect of SHD treatment on cell viability was assessed by MTT assay. (B) The effect of SHD treatment on cell viability subjected to OGD/R. (C) The lactate dehydrogenase (LDH) release levels. (D) Cell apoptosis was determined by Annexin V-FITC/PI staining. (E) Analysis of the apoptotic index. n = 6, #p < 0.05, compared with the control group; *p < 0.05, **p < 0.01, compared with the OGD group.
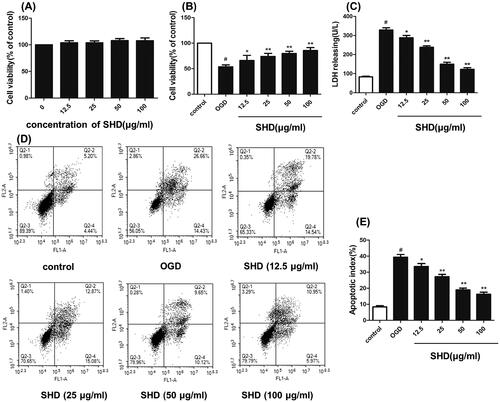
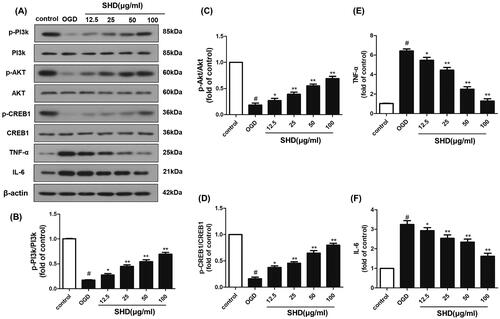
Figure 8. SHD promoted the phosphorylation of PI3k, Akt and CREB expression, and decreased TNF-α and IL6 expression. (A) The expression of p-PI3k, p-Akt, p-CREB, TNF-α and IL6 was detected by Western blotting. (B) SHD treatment increased the phosphorylation of PI3k. (C) SHD treatment increased the phosphorylation of Akt. (D) The expression of p-CREB1 was increased by treatment with SHD. (E) The expression of TNF-α was decreased by treatment with SHD. (F) SHD treatment mediated IL-6 expression compared with that in the untreated OGD group. n = 6, #p < 0.05, compared with the control group; *p < 0.05, **p < 0.01, compared with the OGD group.