Figures & data
Figure 1. Effect of Cordycepin (COR) on the viability of mouse Leydig TM3 cells. (a): The chemical structure of COR. (b): The cell viability in COR treated TM3 cells. (c): The effect of COR on hydrogen peroxide (H2O2)-induced TM3 cells. TM3 cells were treated with indicated concentrations of COR in the presence or absence of 200 μM H2O2 at 37 °C for 24 h. Cell viability was evaluated using the MTT assay and the results are shown as percentage of the control samples. Data are expressed as the mean ± SD (n = 6). #p < 0.05, ##p < 0.01 and ###p < 0.001 compared with control. *p < 0.05, **p < 0.01 and ***p < 0.001, compared to cells exposed to H2O2.
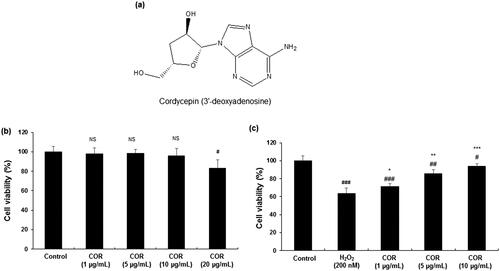
Table 1. Primers used in the study.
Figure 2. The effect of cordycepin (COR) on the protein expression of antioxidant enzyme in hydrogen peroxide (H2O2)-induced TM3 cells. (a) Protein expression of GSTm5, GPx4, and PRx3 analysed by western blotting. (b-d) Relative expression levels (fold) of GSTm5, GPx4, and PRx3 in three independent experiments, respectively. β-Actin was used as an internal control. The data are expressed as the mean ± SD (n = 6). #p < 0.05, ##p < 0.01 and ###p < 0.001 compared with control. *p < 0.05, **p < 0.01 and ***p < 0.001, compared to cells exposed to H2O2. GSTm5: glutathione-S-transferase m5, GPx4: glutathione peroxidase 4 and PRx3: peroxiredoxin 3.
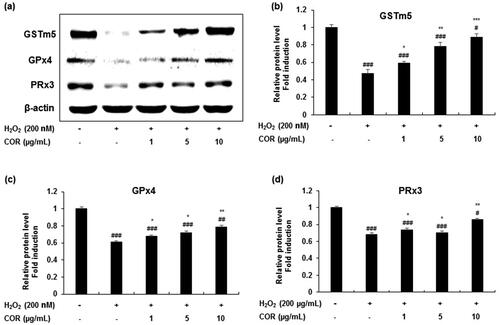
Figure 3. The effect of COR on the mRNA expression of antioxidant enzyme in hydrogen peroxide (H2O2)-induced TM3 cells. (a): The mRNA expression of GSTm5, GPx4, and PRx3 analysed by RT-PCR. (b-d): Relative expression levels (fold) of GSTm5, GPx4, and PRx3 in three independent experiments, respectively. GAPDH was used as an internal control. The data are expressed as the mean ± SD (n = 6). #p < 0.05 and ###p < 0.001 compared with control. *p < 0.05, **p < 0.01 and ***p < 0.001, compared to cells exposed to H2O2. COR: cordycepin, GSTm5: glutathione-S-transferase m5, GPx4: glutathione peroxidase 4 and PRx3: peroxiredoxin 3, GAPDH: Glyceraldehyde 3-phosphate dehydrogenase, RT-PCR: reverse transcriptase-polymerase chain reaction.
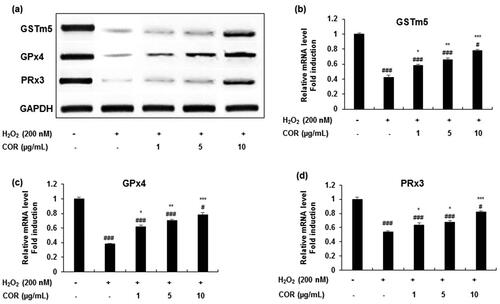
Figure 4. Effect of cordycepin (COR) on lipid peroxidation and testosterone levels in hydrogen peroxide (H2O2)-induced TM3 cells. (a) Effect of COR on H2O2-induced lipid peroxidation in TM3 cells. TM3 cells treated with COR were incubated in the presence or absence of 200 μM H2O2 at 37 °C for 24 h. Total cell lysate from cultured cells was analysed for malondialdehyde (MDA) formation. (b): Effect of COR on H2O2-induced testosterone production in TM3 cells. Data are expressed as the mean ± SD (n = 6). #p < 0.05, ##p < 0.01 and ###p < 0.001 compared with control. *p < 0.05, **p < 0.01 and ***p < 0.001, compared to cells exposed to H2O2.
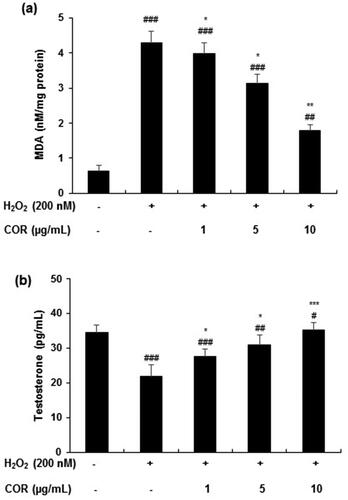
Figure 5. The effect of cordycepin (COR) on the protein expression of spermatogenesis-related molecules and in hydrogen peroxide (H2O2)-induced TM3 cells. (a): Protein expression of nectin-2, and inhibin-α analysed by western blotting. (b, c): Relative expression levels (fold) of nectin-2, and inhibin-α in three independent experiments, respectively. β-actin was used as an internal control. The data are expressed as the mean ± SD (n = 6). #p < 0.05, ##p < 0.01 and ###p < 0.001 compared with control. *p < 0.05, **p < 0.01 and ***p < 0.001, compared to cells exposed to H2O2.
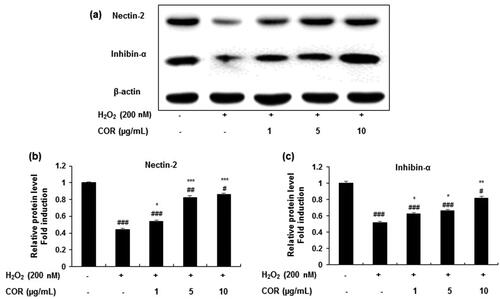
Figure 6. The effect of cordycepin (COR) on the mRNA expression of spermatogenesis-related molecules and in hydrogen peroxide (H2O2)-induced TM3 cells. (a): The mRNA expression of nectin-2, and inhibin-α analysed by RT-PCR. (b-d): Relative expression levels (fold) of nectin-2, and inhibin-α in three independent experiments, respectively. GAPDH was used as an internal control. The data are expressed as the mean ± SD (n = 6). ##p < 0.01 and ###p < 0.001 compared with control. *p < 0.05, **p < 0.01 and ***p < 0.001, compared to cells exposed to H2O2. GAPDH: Glyceraldehyde 3-phosphate dehydrogenase, RT-PCR: reverse transcriptase-polymerase chain reaction.
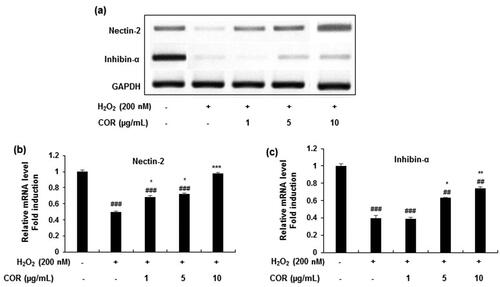
Figure 7. Effect of COR on testis lipid peroxidation (LPO) and enzymatic levels in aged rats. MDA level (a), SOD level (b), CAT level (c), GPx level (d), GR level (e) and GST level (f). The results are expressed as mean ± SD (n = 6), where #p < 0.05 compared with YC group, *p < 0.05 compared with AC group. YC: young rats; AC: aged rats; COR 20: cordycepin (COR) 20 mg/kg treated aged rats; MDA: malondialdehyde, SOD: superoxide dismutase; CAT: catalase; GPx: glutathione peroxidase; GR: glutathione reductase and GST: glutathione-S-transferase.
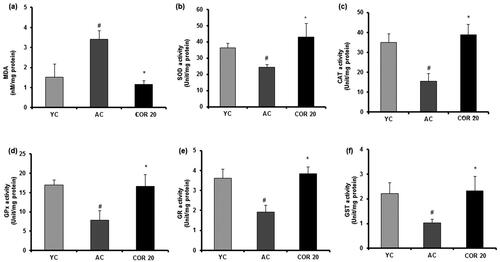
Figure 8. Effect of COR on testis non-enzymatic antioxidant in aged rats. GSH level (a), vitamin C level (b) and vitamin E level (c). The results are expressed as mean ± SD (n = 6), where #p < 0.05 compared with YC group and *p < 0.05 compared with AC group. YC: young rats; AC: aged rats; COR 20: cordycepin (COR) 20 mg/kg treated aged rats; GSH: reduced glutathione; vitamin C: ascorbic acid and vitamin E: α-tocopherol.
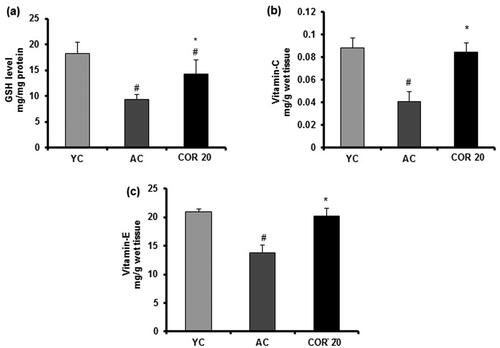
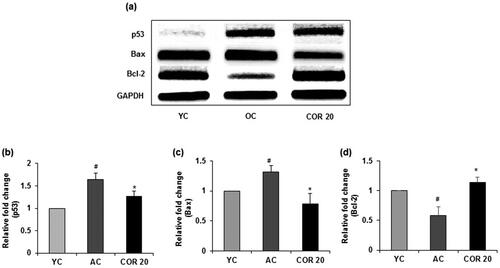
Figure 9. Effect of COR on testicular pro- and anti-apoptotic related protein expression in aged rats. (a) Western blotting analysis of p53, Bax and Bcl-2. Relative expression levels (fold) of p53 (b), Bax (c) and Bcl-2 (d) in three independent experiments, respectively. β-actin was used as an internal control. Data are expressed as the mean ± SD (n = 6). #p < 0.05 and ##p < 0.01 compared with YC group and *p < 0.05, compared to AC group. YC: young rats; AC: aged rats; COR 20: cordycepin (COR) 20 mg/kg treated aged rats; Bcl-2: B-cell lymphoma-2; Bax: Bcl-2-associated X.
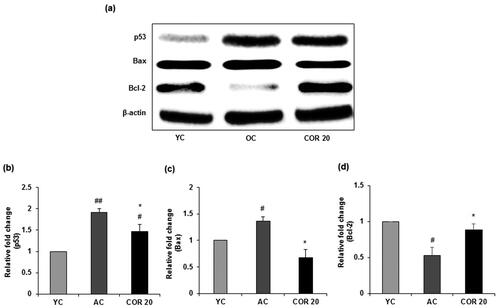
Figure 10. Effect of COR on testicular pro- and anti-apoptotic related mRNA expression in aged rats. RT-PCR analysis of p53, Bax and Bcl-2 mRNA expression (a). Relative expression levels (fold) of p53 (b), Bax (c) and Bcl-2 (d) in three independent experiments, respectively. GAPDH was used as an internal control. Data are expressed as the mean ± SD (n = 6). #p < 0.05 compared with YC group and *p < 0.05, compared to AC group. YC: young rats; AC: aged rats; COR 20: cordycepin (COR) 20 mg/kg treated aged rats; Bcl-2: B-cell lymphoma-2; Bax: Bcl-2-associated X; RT-PCR: reverse transcriptase-polymerase chain reaction.