
Figures & data
Figure 1. Flowchart depicting the study design.
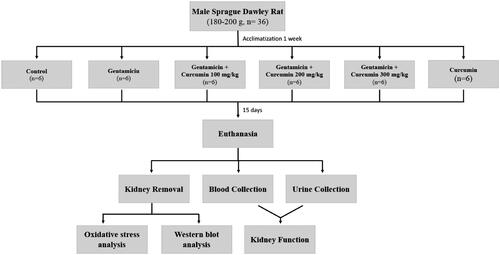
Table 1. Effect of curcumin on body weight and kidney weight changes and biomarkers of kidney function.
Figure 2. Effect of curcumin on renal cortical MDA (A), GSH (B) and SOD (C) levels. The levels MDA, GSH and SOD were determined after treatment of curcumin (CUR) at doses of 100, 200 and 300 mg/kg in gentamicin-treated group (GM) compared to control (CON). Data are mean ± SEM of six rats. *p < 0.05 vs. CON; †p < 0.05 vs. GM. ‡p < 0.05 vs. GM + CUR 100.
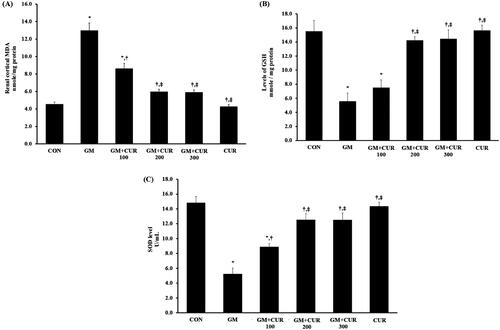
Figure 3. Effect of curcumin on Kim-1, NGAL, nephrin, podocin and TGF-β expression in the renal cortex. The expression of Kim-1 (A), NGAL (B), nephrin (C) and podocin (D) TGF-β (3E) was determined after treatment of curcumin (CUR) at doses of 200 mg/kg in gentamicin-treated group (GM) compared to control (CON) using Western blot analysis. Bar graphs indicate means ± SEM (n = 5). *p < 0.05 vs. CON; †p < 0.05 vs. GM.
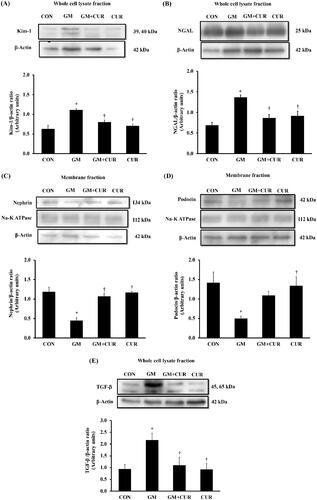
Figure 4. Effect of curcumin on GRP78, CHOP, calpain 2, caspase 12 and cleaved caspase-7 expression in the renal cortex. The expression of GRP78 (A), CHOP (B), calpain-2 (C), caspase-12 (D) and cleaved caspase-7 (E) proteins was determined after treatment of curcumin (CUR) at doses of 200 mg/kg in gentamicin-treated group (GM) compared to control (CON) using Western blot. Bar graphs indicate means ± SEM (n = 5). *p < 0.05 vs. CON; †p < 0.05 vs. GM.
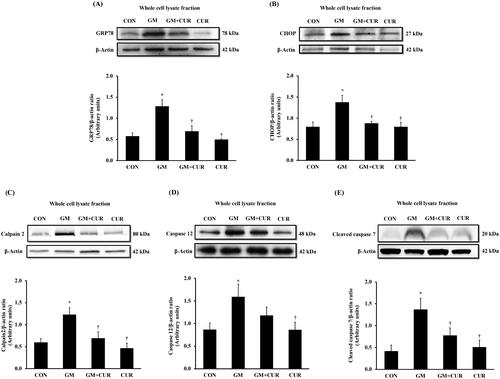
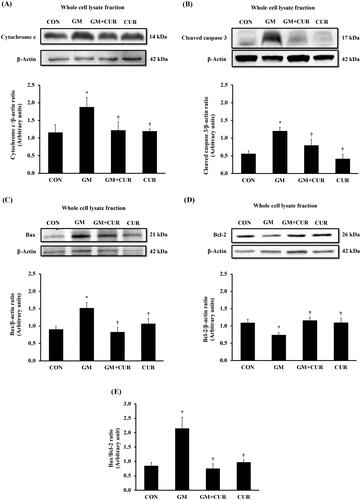
Figure 5. Effect of curcumin on cytochrome c, cleaved caspase 3, Bax and Bcl-2 expression in the renal cortex. The expression of cytochrome-c (A), cleaved caspase-3 (B), Bax (C), Bcl-2 (D) proteins and densitometric analysis of the ratio of Bax to Bcl-2 (E) was determined after treatment of curcumin (CUR) at doses of 200 mg/kg in gentamicin-treated group (GM) compared to control (CON) using Western blot analysis. Bar graphs indicate means ± SEM (n = 5). *p < 0.05 vs. CON; †p < 0.05 vs. GM.
Data availability statement
The data that support the findings of this study are available from the corresponding author upon reasonable request.