
Figures & data
Table 1. Raw data of microarray detection.
Table 2. Primer information.
Table 3. Determination of treating concentration of berberine in vitro assays.
Table 4. Antibody information.
Figure 1. RT-qPCR validation of miR expression levels. The expression levels of 10 miRs in either upregulated members (A) or downregulated members (B) were validated by RT-qPCR.
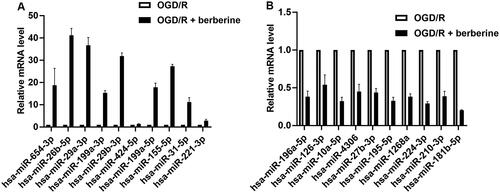
Figure 2. Berberine increased viability while suppressed apoptosis in OGD/R-treated cardiomyocytes. Cells were pre-treated with berberine of 10 or 20 μM 24 h before OGD/R treatment. The cell viability was detected using CCK-8 assay (A). The cell apoptosis was detected using apoptosis detection kit in a flow cytometer (B). The expression levels of apoptosis-related factors were detected using western blotting assays (C). *p< 0.05 vs. control group. #p< 0.05 vs. OGD/R group.
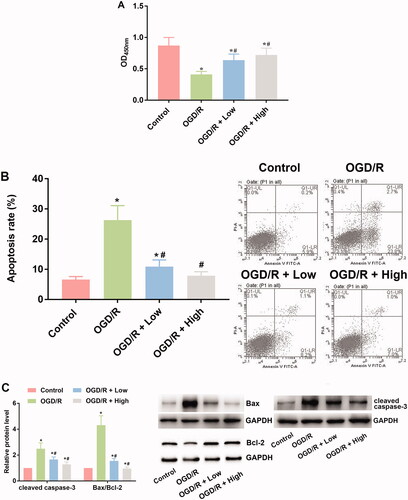
Figure 3. Berberine inhibited inflammation and oxidative in OGD/R-treated cardiomyocytes. Cells were pre-treated with berberine of 10 or 20 μM 24 h before OGD/R treatment. The levels of GSH (A), GSH-Px (B), SOD (C), MDA (D), IL-1β (E), TNF-α (F) and IL-6 (G) were detected using corresponding kits. *p< 0.05 vs. control group. #p< 0.05 vs. OGD/R group.
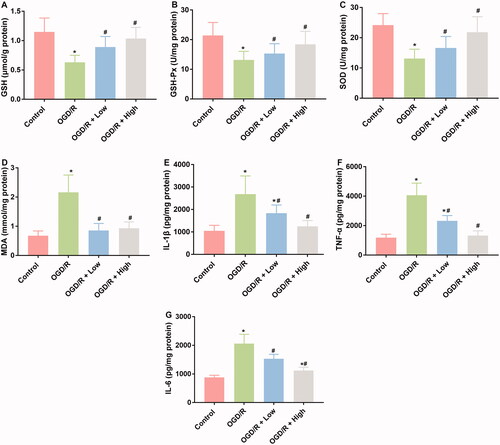
Figure 4. Berberine suppressed oxidative stress and inflammatory response, induced miR-26b-5p level, while inhibited the PTGS2/ERK/JNK/P38 pathway in OGD/P-treated cardiomyocytes cells. Cells were pre-treated with berberine of 10 or 20 μM 24 h before OGD/R treatment. The expression level of miR-26b-5p was detected using RT-qPCR (A). The expression levels of members in the PTGS2/ERK/JNK/P38 pathway were detected using western blotting assays (B). *p< 0.05 vs. control group. #p< 0.05 vs. OGD/R group.
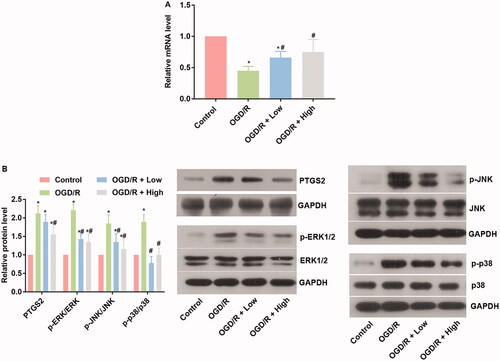
Figure 5. Inhibition of miR-26b-5p impaired cell viability and induced apoptosis in OGD/R and berberine-treated cardiomyocytes cells. Cells were transfected with miR-26b-5p inhibitor and then subjected to berberine and OGD/R treatments. The expression level of miR-26b-5p was detected using RT-qPCR (A). The cell viability was detected using CCK-8 assay and represented by OD value at 450 nm (B). The cell apoptosis was detected using apoptosis detection kit in a flow cytometer (C). *p< 0.05 vs. OGD/R group. #p< 0.05 vs. OGD/R + high group.
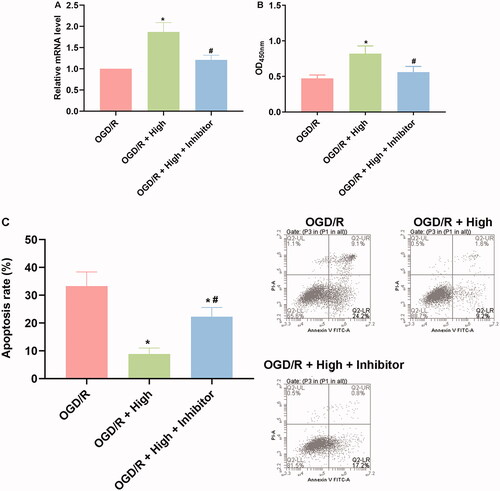
Figure 6. Berberine improved ECG pattern in I/R rats by inducing the level of miR-26b-5p. Arrow indicates the elevated ST segment of ECG.
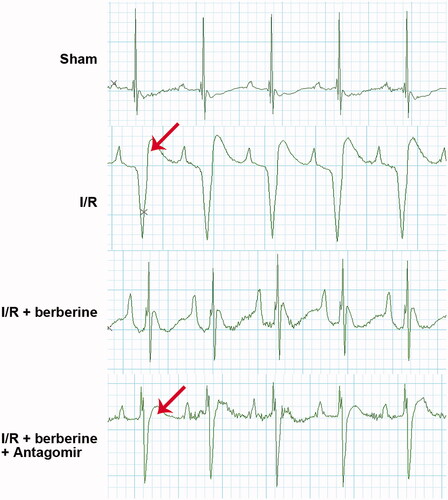
Figure 7. Inhibition of miR-26b-5p influenced cardiac function in model rats treated with berberine. Rats were subjected to injection of miR-26b-5p antagomir, gavaged of 50 mg/kg body weight berberine or I/R surgery in different combinations. The levels of LVESP (A), LVEDP (B), LVESD (C), LVEDD (D) and FS (E) were measured using non-invasive blood pressure system or using Philips iE33 system. *p< 0.05 vs. sham group. #p< 0.05 vs. I/R group. &p< 0.05 vs. I/R + berberine group.
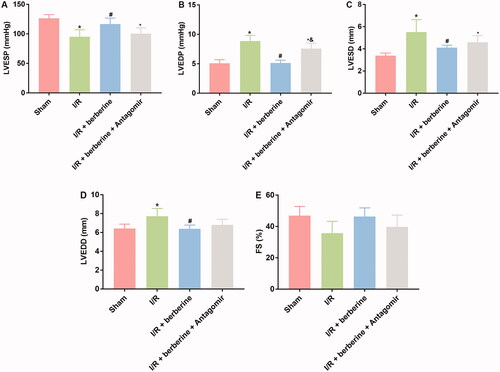
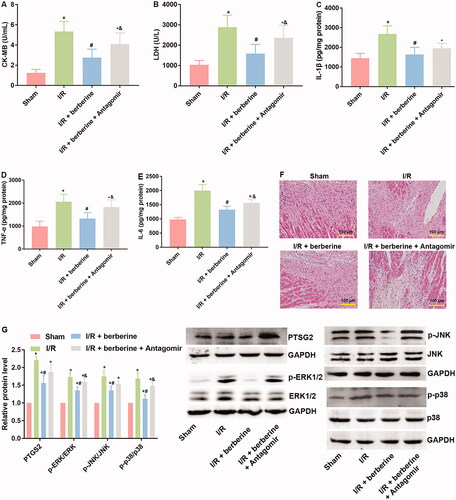
Figure 8. Inhibition of miR-26b-5p re-induced inflammatory response, attenuated histological destruction and suppressed PTGS2/ERK/JNK/P38 pathway in myocardial tissues in model rats treated with berberine. Rats were subjected to injection of miR-26b-5p antagomir, gavaged of 50 mg/kg body weight berberine or I/R surgery in different combinations. The myocardial levels of lactate LDH (A), CK (B), IL-1β (C), TNF-α (D) and IL-6 (E) were measured using corresponding kits. Histological changes in myocardial tissues were detected with H&E staining (F). The expression levels of members in PTGS2/ERK/JNK/P38 pathway were detected using western blotting assays (G). *p< 0.05 vs. Sham group. #p< 0.05 vs. I/R group. &p< 0.05 vs. I/R + berberine group.
Data availability statement
The data will be provided by the corresponding author on request.