
Figures & data
Figure 1. The molecular structure of PA: C15H26O.
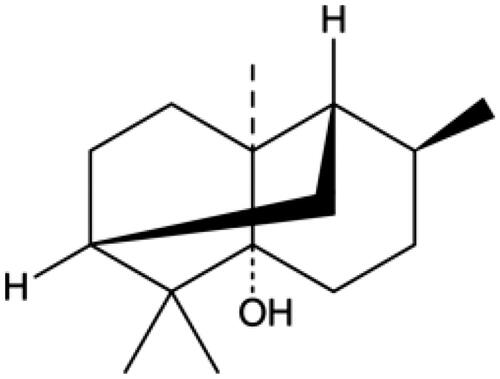
Figure 2. The effect of PA on cardiac function in MI/R injured hearts. (A) Cardiac function was assessed by echocardiography 48 h after MI/R operation. (B) Hemodynamic parameter changes in LVESD, LVEED, LVEF and LVFS were detected. Data are expressed as the mean ± SD. ***p < 0.001 vs. sham group. ▲▲▲p < 0.001 vs. MI/R group. LVEDD: left ventricular end diastolic diameter; LVEF: left ventricular ejection fraction; LVESD: left ventricular end systolic diameter; LVFS: left ventricular fractional shortening.
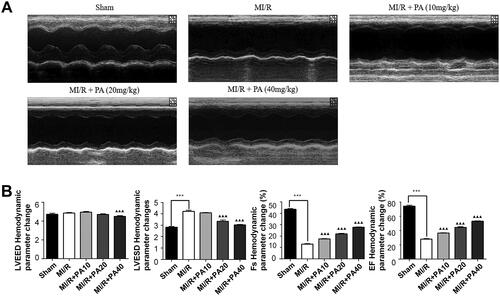
Figure 3. The effect of PA treatment on myocardial infarction and myocardial injury in MI/R mice. (A) Calculation of myocardial infarction volume (AAR/LV, INF/AAR) and LDH content. (B) Myocardial tissue was stained with H&E. ***p < 0.001 vs. sham group. ▲▲p < 0.01, ▲▲▲p < 0.001 vs. MI/R group. Data are expressed as the mean ± SD. (C,D) TTC staining was used to determine the mouse myocardial infarction rate in the indicated groups. ▲▲p < 0.01 vs. sham group. **p < 0.01 vs. MI/R group.
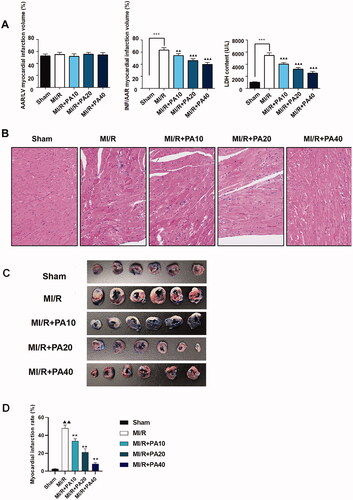
Figure 4. The effect of PA treatment on myocardial infarction and myocardial apoptosis in MI/R mice. (A) Concentrations of myocardial infarction factors (CK-MB, cTnI and cTnT) were detected by ELISA. (B,C) A TUNEL assay was used to evaluate the effect of PA on apoptosis in myocardial tissue. ***p < 0.001 vs. sham group. ▲▲p < 0.01, ▲▲▲p < 0.001 vs. MI/R group. Data are expressed as the mean ± SD.
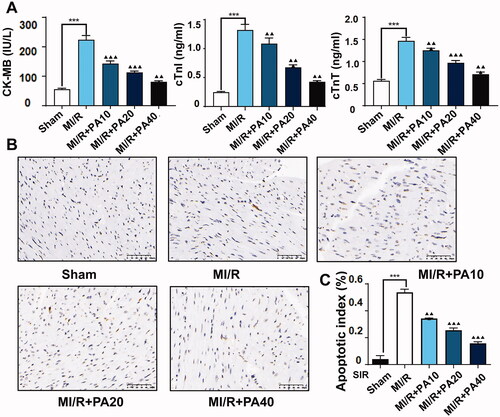
Figure 5. The effect of PA treatment on the Notch1/Hes1 signalling pathway and ER stress in MI/R mice. Western blotting was used to detect the levels of Notch1, NICD, Hes1, ATF4, PERK, p-PERK, caspase-3 and p-caspase-3 in MI/R mouse myocardial tissue. (A) Western blot bands of the detected proteins. (B) Relative expression levels of the proteins. ***p < 0.001 vs. sham group. ▲▲p < 0.01, ▲▲▲p < 0.001 vs. MI/R group. Data are expressed as the mean ± SD.
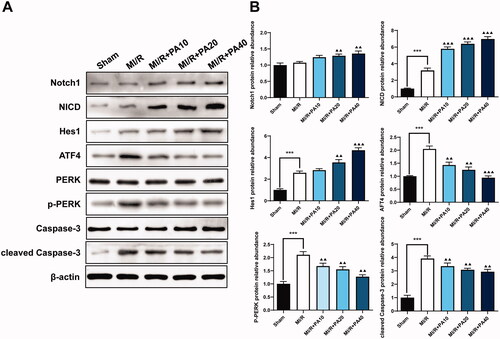
Figure 6. The effect of PA treatment on cell viability and apoptosis in SIR-treated H9C2 cells. (A) The effect of different concentrations of PA on H9C2 cell viability was determined by CCK-8 assay. (B) The effect of different concentrations of PA on SIR-treated H9C2 cell viability was determined by CCK-8 assay. **p < 0.01 vs. the control group. ▲p < 0.05 ▲▲p < 0.01 vs. the SIR group. Data are expressed as the mean ± SD.
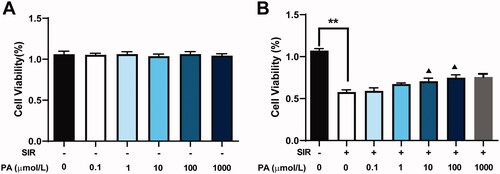
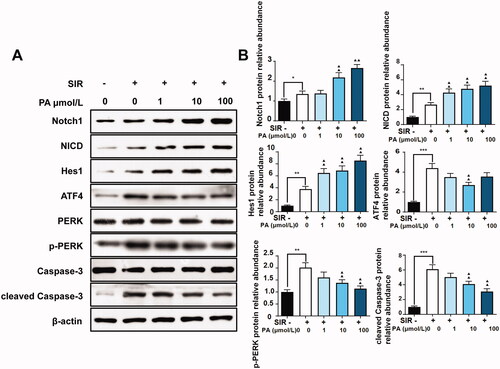
Figure 7. The effect of PA treatment on the Notch1/Hes1 signalling pathway and ER stress in H9C2 cells. Western blotting was used to detect the effect of PA on the contents of Notch1, NICD, Hes1, ATF4, PERK, p-PERK, caspase-3 and p-caspase-3 in SIR-treated H9C2 cells. (A) Western blot bands of the detected proteins. (B) Relative expression levels of the proteins. **p < 0.01, vs. control group. ▲p < 0.05, ▲▲p < 0.01 vs. the SIR group. Data are expressed as the mean ± SD.
Data availability statement
The corresponding author can provide the data that support the findings of this study upon request.