
Figures & data
Figure 1. Network pharmacology analysis of Chinese medicine to pneumonia. (A) The effective chemical components corresponding to inflammation lung disease are predicted through TCMSP and CTD database. (B) The structure of fraxinol. (C) The target proteins corresponding to pneumonia and fraxinol are predicted by CTD, malacards, disgenet, and Swiss Target Prediction databases, respectively. (D) The related signalling pathways were predicted through overlapping analysis of the pneumonia signalling and target proteins.
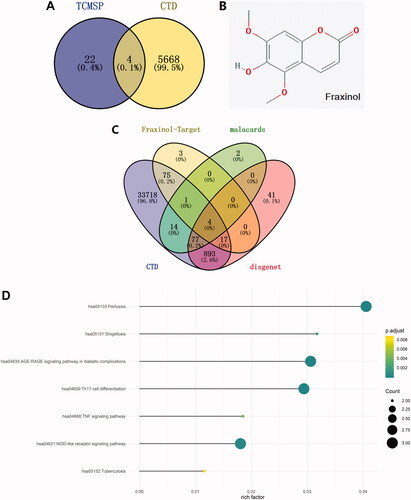
Figure 2. Fraxinol attenuates LPS-induced ALI in mice. (A,B) Histological changes were evaluated by using H&E staining. Bar = 20 μm. (C) The lung W/D ratio was used to assess the pulmonary edoema. (D,E) Apoptotic cells were measured by TUNEL assay. Bar = 20 μm. (F) The level of MPO activity. (G) Effect of fraxinol on total proteins in BALF. (H,I) TNF-α and IL-1β levels in BALF were measured by ELISA kits. *p < 0.05 vs. Control group; #p < 0.05 vs. LPS group.
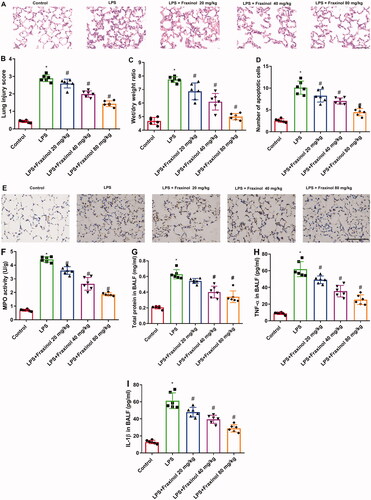
Figure 3. Fraxinol alleviates LPS-induced ALI by equilibrating ACE-Ang II-AT1R and ACE2-Ang (1-7)-Mas in mice. (A–C) The protein expression of ACE and AT1R was measured using Western blot assay. (D) The level of Ang II was detected by ELISA kit. (E–G) The protein expression of ACE2 and MasR was measured using Western blot assay. (H) The level of Ang (1–7) was detected by ELISA kit. *p < 0.05 vs. control group; #p < 0.05 vs. LPS group.
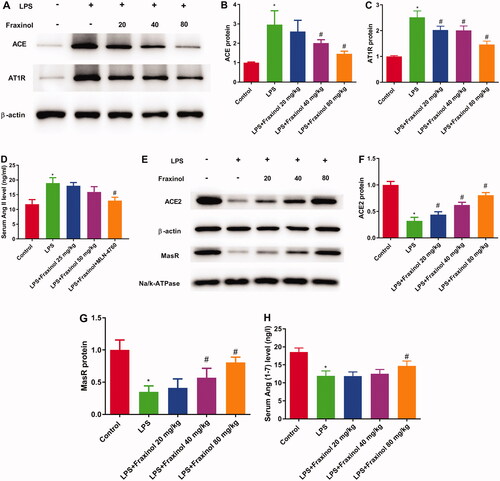
Figure 4. Fraxinol ameliorates LPS-induced NLRP3 inflammasome in mice. (A–E) The protein expression of NLRP3, ASC, pro-caspase-1, and cleaved caspase-1 was measured using Western blot assay. *p < 0.05 vs. Control group; #p < 0.05 vs. LPS group.
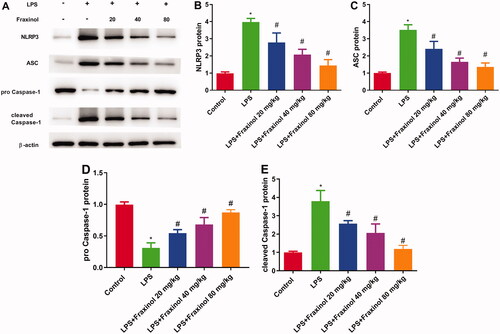
Figure 5. Fraxinol ameliorates LPS-induced Raw264.7 cell inflammation and apoptosis. (A,B) Effects of fraxinol on LPS-induced TNF-α and IL-1β levels in Raw264.7 cells were detected by ELISA kits. (C,D) Effects of fraxinol on LPS-induced apoptosis in Raw264.7 cells were detected by flow cytometry. *p < 0.05 vs. Control group; #p < 0.05 vs. LPS group; +p < 0.05 vs. LPS + Fraxinol (25 μM) group.
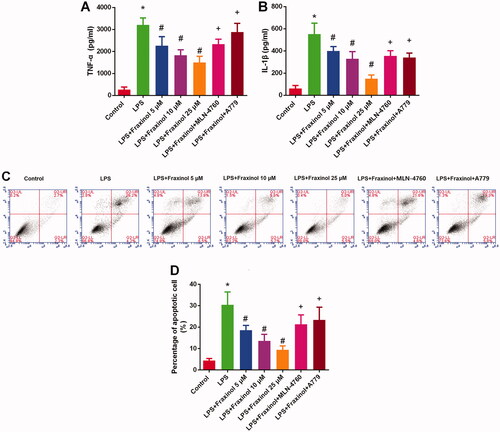
Figure 6. Fraxinol equilibrates ACE-Ang II-AT1R and ACE2-Ang (1-7)-Mas axis in Raw264.7 cells. (A–C) The protein expression of ACE and AT1R was measured by Western blot assay. (D–F) The protein expression of ACE2 and MasR was measured by Western blot assay. *p < 0.05 vs. Control group; #p < 0.05 vs. LPS group; +p < 0.05 vs. LPS + Fraxinol (25 μM) group.
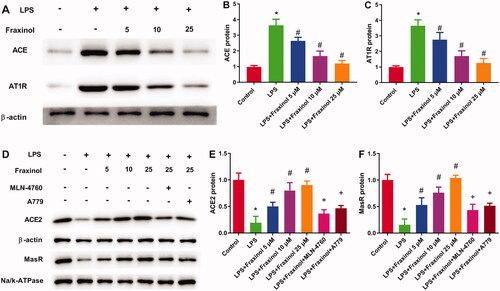
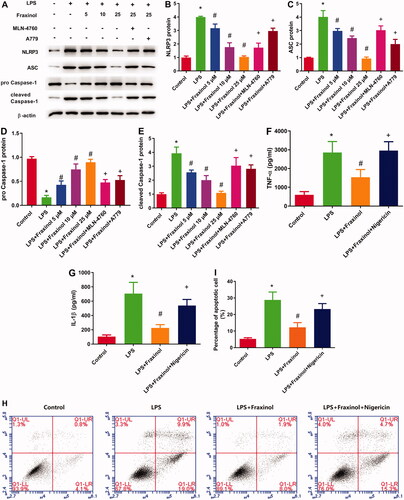
Figure 7. Fraxinol inhibits LPS-induced Raw264.7 cell inflammation and apoptosis via regulation of NLRP3. (A–E) The protein expression of NLRP3, ASC, pro-caspase-1, and cleaved caspase-1 was measured by Western blot assay. (F,G) Effects of fraxinol and nigericin on LPS-induced TNF-α and IL-1β levels in Raw264.7 cells were detected by ELISA kits. (H,I) Effects of fraxinol and nigericin on LPS-induced apoptosis in Raw264.7 cells were detected by flow cytometry. *p < 0.05 vs. Control group; #p < 0.05 vs. LPS group; +p < 0.05 vs. LPS + Fraxinol (25 μM) group.
Data availability statement
The datasets used and analysed during the current study are available from the corresponding author on reasonable request.