Figures & data
Figure 1. The flowchart of the technical strategy used in this study. Experimental methods include target prediction for YQCM’s compound and ARHL, construction and topological analysis on compound-target network and PPI network, enrichment analysis on GO and KEGG pathway, molecular docking, and in vitro study.
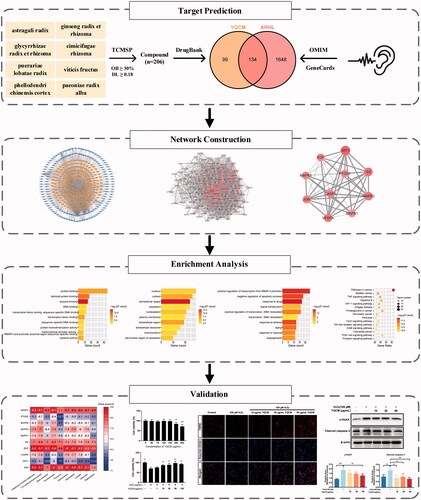
Figure 2. Network of the ingredient-action target. The blue oval cycle is on behalf of the active compound from YQCM. The yellow squares represent the compound’s target.
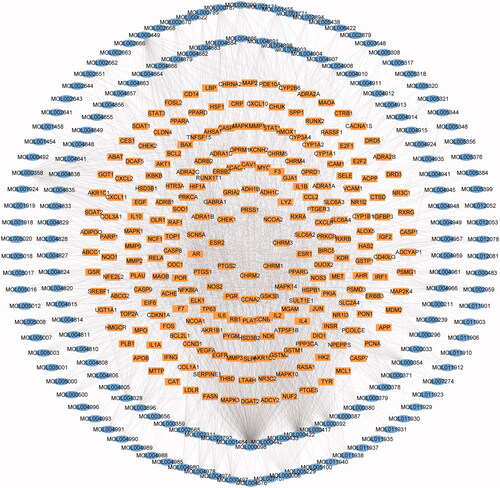
Table 1. Characters of core compounds in YQCM decoction.
Figure 3. YQCM’s therapeutic targets for ARHL and their Protein-Protein interactions. (A) 134 common targets shared with YQCM and ARHL were obtained by the Venn map. (B) The PPI network of potential targets of ELZC working on ARHL was acquired from the STRING database. (C)The interaction between the top 10 hub targets was visualised by Cytoscape software. In the network, the colour and size of nodes reflected degree centrality, while the edge thickness reflected the combined score.
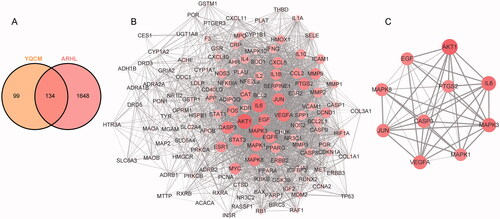
Table 2. Characters of ten core therapeutic targets.
Figure 4. Enrichment analysis of Gene ontology and KEGG pathway. 52 targets with a degree greater than the median were applied for enrichment analysis. Gene Ontology including biological processes (A), cellular components (B), molecular functions (C), and KEGG pathway (D) was analysed by DAVID. The statistical significance threshold of enrichment analysis was established at p < 0.05.
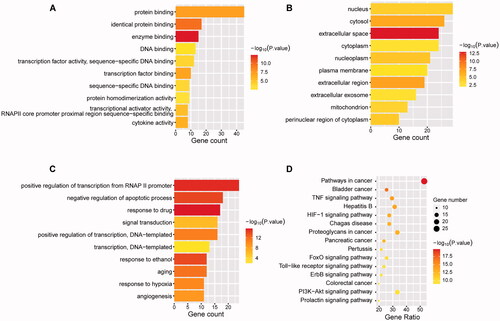
Figure 5. Heatmap of molecular docking results. The x-axis represents ten core active bioactive compounds; the y-axis represents the hub targets. The docking score represents the lowest binding energy of compounds-target molecular docking (kJ/mol).
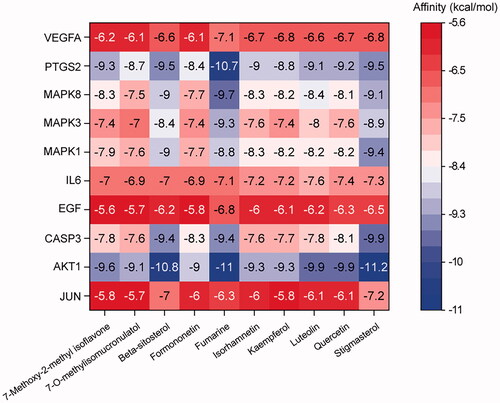
Figure 6. The picture of the RMSD value of the molecular complex system in 100 ns time interval. The dynamic stability of AKT1 with 7-Metho-2-met_isoflavone (A), AKT1 with β-sitosterol (B), AKT1 with fumarine (C), AKT1 with luteolin (D), AKT1 with quercetin (E), AKT1 with stigmasterol (F), CASP3 with stigmasterol (G), MAPK8 with fumarine (H), PTGS2 with β-sitosterol (I), PTGS2 with fumarine (J).
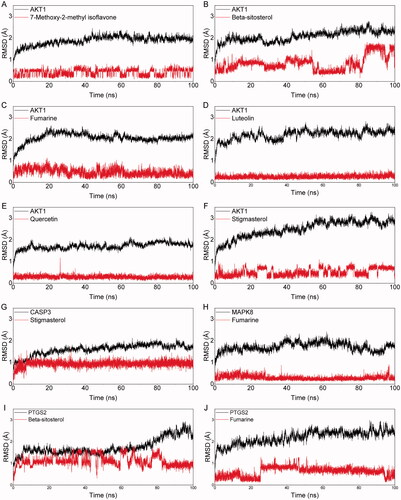
Table 3. Binding free energies and energy components are predicted by MM/GBSA (kcal/mol).
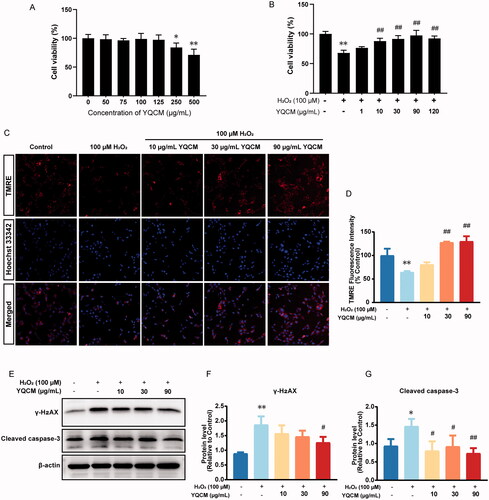
Figure 7. YQCM decoction exhibits anti-apoptotic activity, protecting Hei-oc1 cells from DNA damage induced by H2O2. (A) HEI-OC1 cells were incubated with YQCM (0, 50, 75, 100, 125, 250, and 500 μg/mL) for 24 h, and then cell viability was determined by CCK8 assay. (B) Cells were exposed to 100 μM H2O2, and cell viability with and without YQCM pre-treatment under oxidative conditions was determined by CCK-8 assay as well. (C and D) Cells were pre-treated with YQCM (10, 30, 90 μg/mL) for 24 h, and the mitochondrial membrane potential of cells with and without YQCM retreatment under oxidative conditions were examined by TMRE immunofluorescence. The fluorescence intensity was quantified with the High-content imaging system (n = 3). (E–G) Western blotting of DNA-damage marker, γH2AX, and apoptosis protein, cleaved caspase-3 (n = 3). The values represent the means ± SD, *p < 0.05 and **p < 0.01 vs. control, #p < 0.05 and ##p < 0.01 vs. H2O2 (Analysis of variance (ANOVA), using Dunnett’s post hoc test).